- SPY Forges a Gap-Gap Reversal
- What Makes this Wedge Break Significant?
- TLT Turns up from Oversold Levels.
- XLC is the First to Break.
 ... The mood of the market appears to be changing as stocks weaken and bonds strengthen. It looks like short-term trends are trying to reverse. The first chart shows the S&P 500 SPDR (SPY) breaking the rising wedge boundary with a sharp decline on Monday. Note that I do not view trend lines as serious support or resistance levels based on demand or support. An angled trend line simply represents the steepness of the ascent or descent. The steeper the positive slope, the steeper than advance. The steeper the negative slope, the steeper the decline. A trend line break signals a change in the rate of ascent or descent.
I draw angled lines on my charts to mark patterns, such as a falling wedge, falling flag or triangle. These lines mark the "boundary" of the pattern and the first level to watch for signs of a break. The chart below shows the wedge boundaries with the blue lines and SPY broke the lower line on Monday.
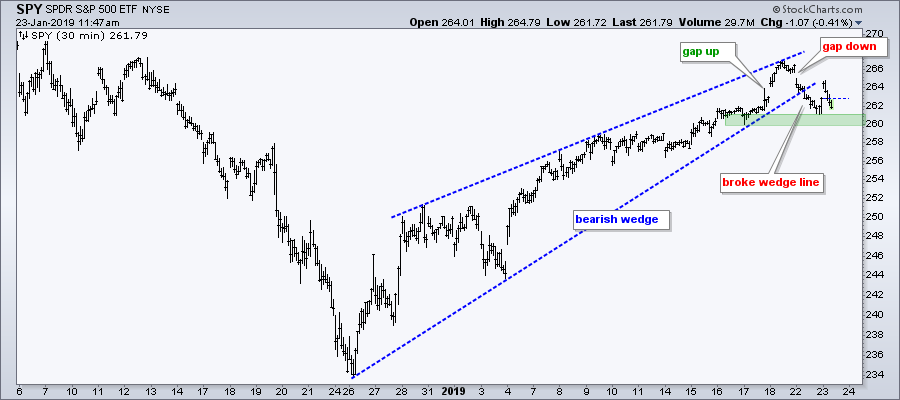
There is also a gap-gap reversal working. Notice how SPY gapped up on Friday and then gapped down on Monday. The gaps do not align for an island reversal, but these two gaps clearly mark a short-term reversal. SPY gapped up on the open today and quickly filled the gap. Last week's low marks support in the 260-261 area and this is the next level to watch for a confirmation break.
What Makes this Wedge Break Significant?
I ignore bearish setups when the bigger trend is up. Conversely, I do not ignore bearish setups when the bigger trend is down. And I think the bigger trend is down for the S&P 500, S&P Mid-Cap 400 and S&P Small-Cap 600. The S&P 500 is below its 200-day SMA, the current advance did not break the early December high and the 50-day SMA is below the 200-day SMA. Despite the bullish breadth thrust in mid January, the other breadth indicators I follow are bearish. Short-term, the chart below shows CCI moving below 100 for the third time in three months.
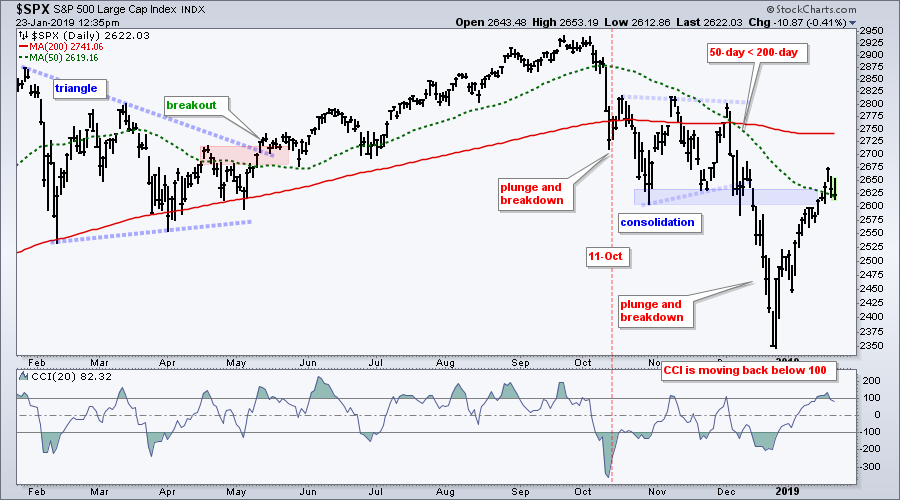
I am getting short-term bearish signals and this argues for further weakness in stocks. As with any signal, I have no idea if it will work or how good it might work. These signals could just lead to choppy trading and volatility - welcome to bear market environments. All signals are equal in my book. They work until proven otherwise or a profit target is reached. At this point, a close above 2675 in $SPX would argue for a re-assessment.
TLT Turns up from Oversold Levels
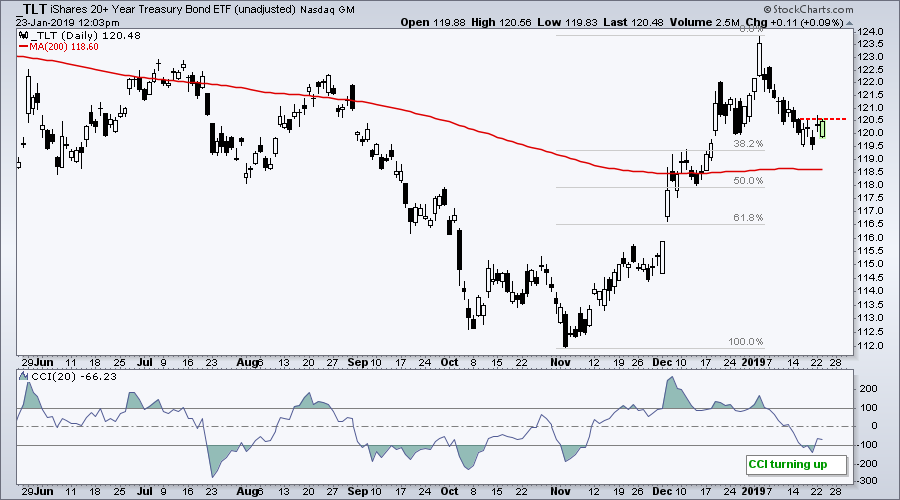
I am seeing the opposite in the 20+ YR T-Bond ETF (TLT) chart. TLT surged above its 200-day SMA and above its summer highs with a HUGE move from early November to early January. The ETF was clearly overbought above 123 and pulled back to alleviate this condition. The decline retraced around 38%, which is the minimum retracement expected. TLT is now firming in the 120 area and showing signs of an uptrend. The indicator window shows CCI turning up from oversold levels and moving back above -100.
XLC is the First to Break
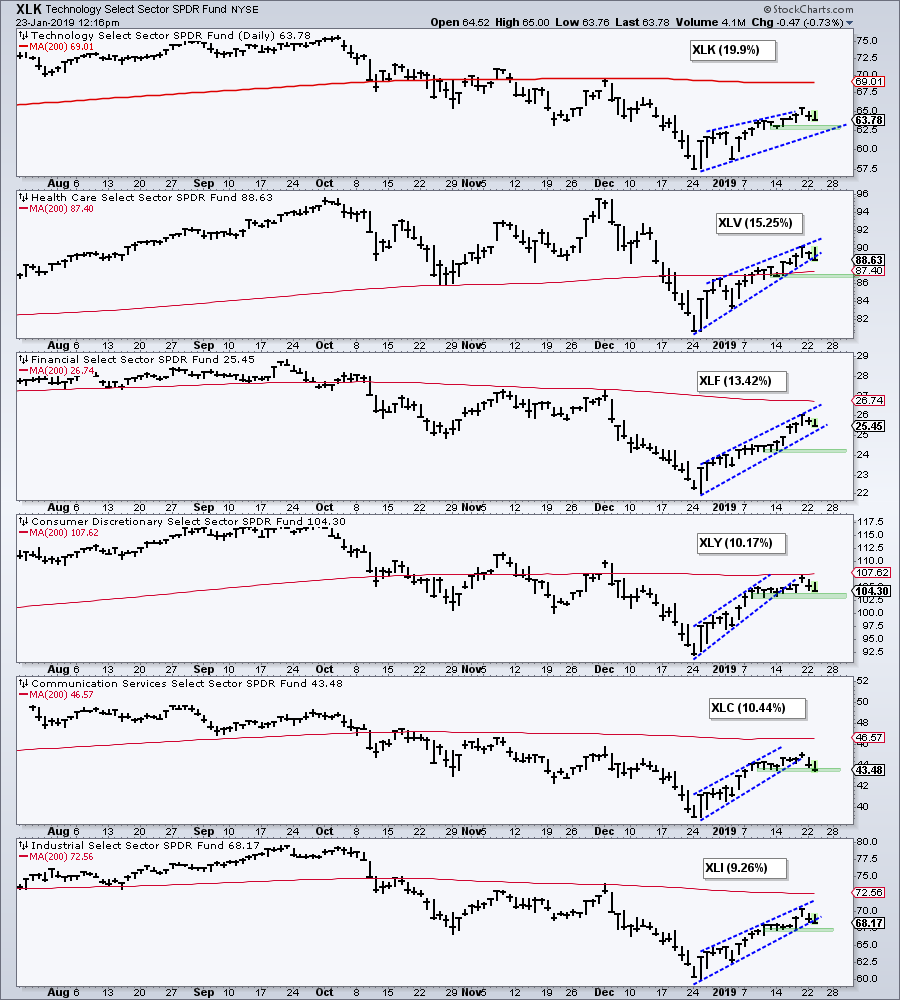
The next chart shows the six biggest sectors in the S&P 500. Together, they account for around 78% of the index and are the key drivers. These six bounced over the last three weeks, but one is looking weaker than the others over the last few days. The green zones mark the mid January low, which is a benchmark low. XLC moved below this low today and is the only sector to do so. Thus, it is the weakest of the big six.
On Trend on YouTube
To Chase or Not to Chase
- Volume is not What is Used to Be
- 2008: Bear Bounce and Bullish Setup
- 2010: Big Bounce and Big Pullback
- 2011: Retracement and Bull Flag
- 2014: October Volatility
- 2015: Volatility and BREXIT Vote
- 2019: What Now?
- Click here to Watch
Questions, Comments or Feedback?
I do not take symbol request and I cannot promise to response to all correspondence, but I will read it and take into under consideration. I greatly appreciate all feedback because it helps me improve the commentary and provides ideas for the future.

- Arthur Hill, CMT
Senior Technical Analyst, StockCharts.com
Book: Define the Trend and Trade the Trend
Twitter: Follow @ArthurHill


