- Volume is not What is Used to Be.
- 2008: Bear Bounce and Bullish Setup.
- 2010: Big Bounce and Big Pullback.
- 2011: Retracement and Bull Flag.
- 2014: October Volatility.
- 2015: Volatility and BREXIT Vote.
- 2019: What Now?
- On Trend on StockChartsTV.
 ... Volume is not What is Used to Be
... I went back over the last ten years to see what happened after a double digit surge in the S&P 500 over a short period of time, three to five weeks. I could have gone back further, but I think the market dynamics changed somewhat in the early 2000s as high frequency trading, dark pools and algorithmic trading picked up speed. While I realize fear, greed and institutions have been around for a long time, the pace and intensity of trading has changed. Conservative estimates suggest that HFT accounts for 10-15% of current trading volume in stocks and dark pools account for around 15%.
Algorithmic trading, which is also used by HFT traders, is also a big part of the stock market now. Marko Kolanovic of JPMorgan estimates that algorithmic trading accounts for some 60% of trading volume. Kolvaniv further argues that trading adjustments from these algorithms, which often use similar strategies, contribute to oversized moves on the upside and the downside.
Note that I could also be suffering some recency bias because I just read "Flash Boys" from Michael Lewis and am currently reading "Dark Pools" from Scott Paterson. Even though authors can sensationalize their stories, high frequency trading, dark pools and algorithmic trading are influencing market movements much more than they were 15 years ago. This is also one of the reasons I rarely use volume in my analysis.
The next charts show seven big surges and the aftermath for the S&P 500. There are two main takeaways. First, bear market rallies can be swift and sharp. Second, if the rally is more than a bear market rally, there is often a bullish setup after the initial surge. This can be a bull flag, bull wedge, retracement and/or candlestick reversal after a pullback. I prefer to wait for such a pullback before jumping on the bandwagon.
On Trend on YouTube
To Chase or Not to Chase (analyzing prior surges)
- Volume is not What is Used to Be
- 2008: Bear Bounce and Bullish Setup
- 2010: Big Bounce and Big Pullback
- 2011: Retracement and Bull Flag
- 2014: October Volatility
- 2015: Volatility and BREXIT Vote
- 2019: What Now?
- Click here to Watch
2008: Bear Bounce and Bullish Setup
The first chart shows the S&P 500 in 2008-2009 with two huge moves in a short period. The first was a 27.8% bear market bounce that peaked well below the 200-day SMA. The S&P 500 broke support in January 2009, formed a bearish continuation pattern into February and broke down again in mid February.
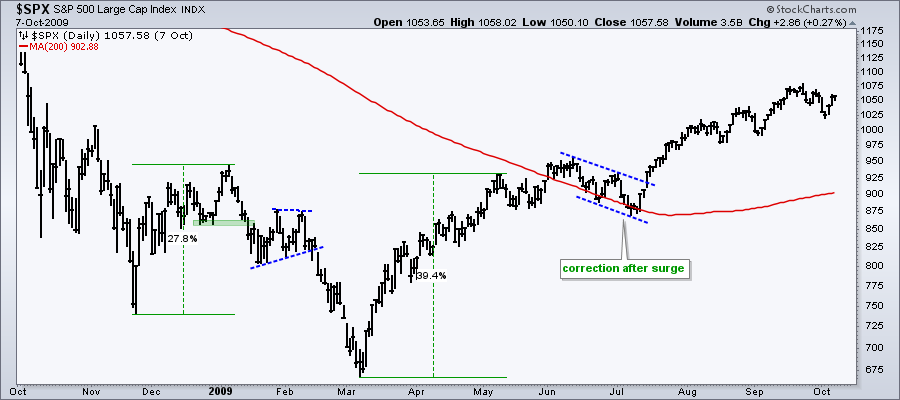
After hitting a new low in early March, the index surged some 40% into May and then corrected from mid June to early July. Notice how a nice falling flag formed and the index broke out with a strong move off the 200-day SMA. This was the bullish setup and subsequent signal after the initial surge.
2010: Big Bounce and Big Pullback
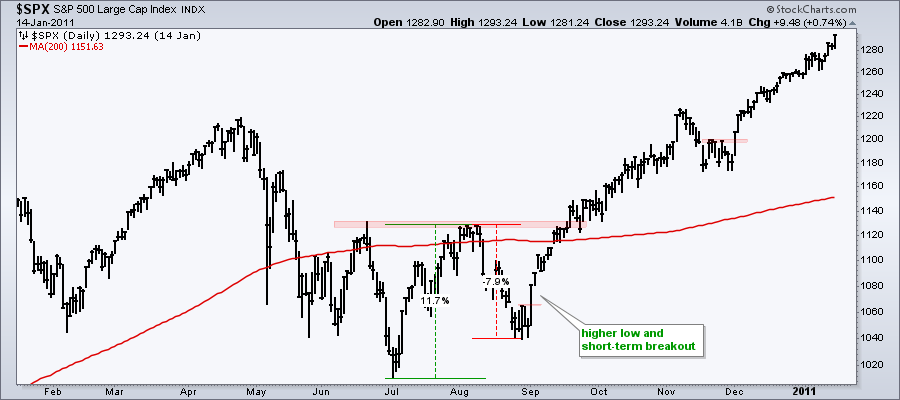
The S&P 500 fell around 17% from late April to early July 2010 with the May flash crash in the middle. HFT got the blame for this. The index surged 11.7% from early July to early August, hit resistance from the June high and fell some 8%. There was a nice setup in early September as the index firmed above the prior low and broke a short-term resistance level with a big move. Another pullback occurred in November and there was a short-term breakout in December. It often pays to wait for a playable pullback.
2011: Retracement and Bull Flag
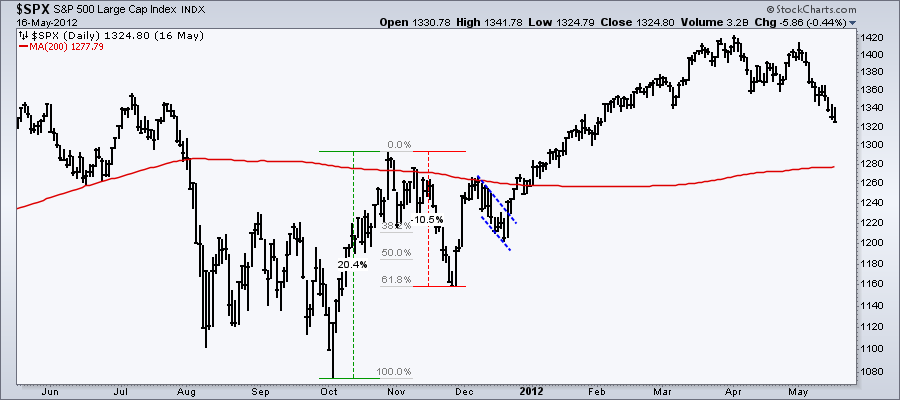
The S&P 500 plunged in August with the European debt crisis and traded in a volatile range until early October. Notice that the index broke "support" from the August low in early October and then surged some 20%. After two "bullish" breaks above the 200-day SMA, the index then fell around 10%. Yes, I am being cynical. Chasing breakdowns and breakouts after big moves is usually not a good idea in volatile times.
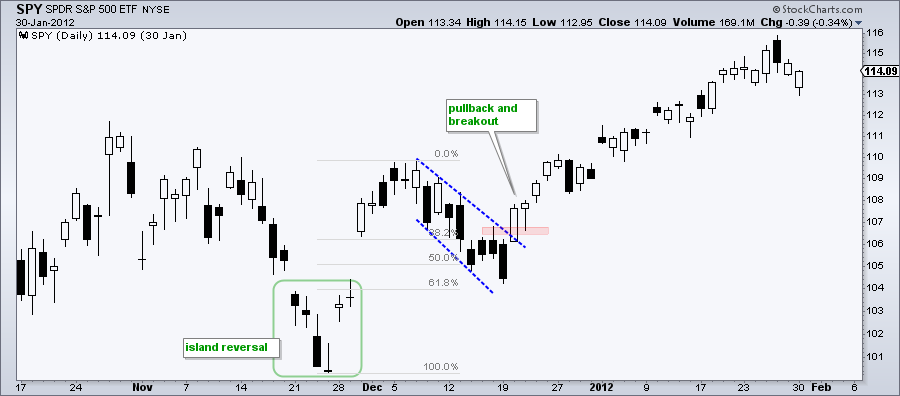
The next chart focuses on the playable pullback using SPY. First, notice that the November pullback reversed right at the 61.8% retracement with a three day reversal: long black candlestick, inverted hammer and gap. There was another gap two days later to form a larger island reversal. Those missing the November reversal got another chance with a bull flag in December that retraced 61.8%. Thus, there were three chances to hop on the bandwagon.
2014: October Volatility
The S&P 500 broke support and the 200-day SMA in October 2014. Even though these breaks lasted five days or longer, they did not hold as the index surged around 14%. This was a good old fashion bear trap. It is easy to see in hindsight, but tough to call at the time.
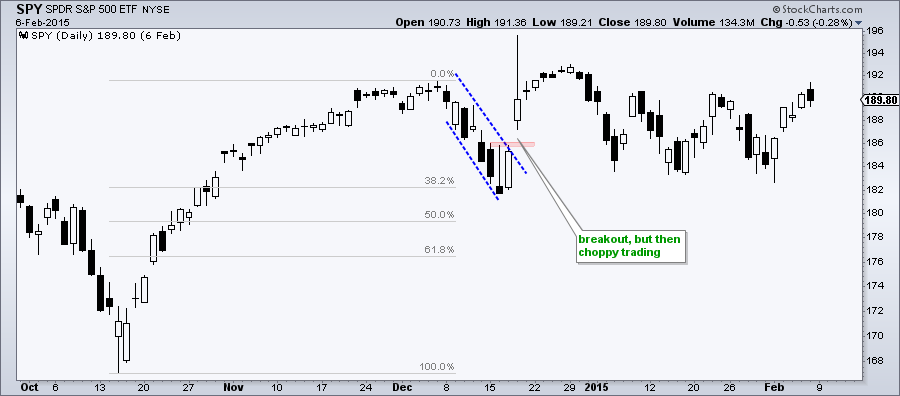
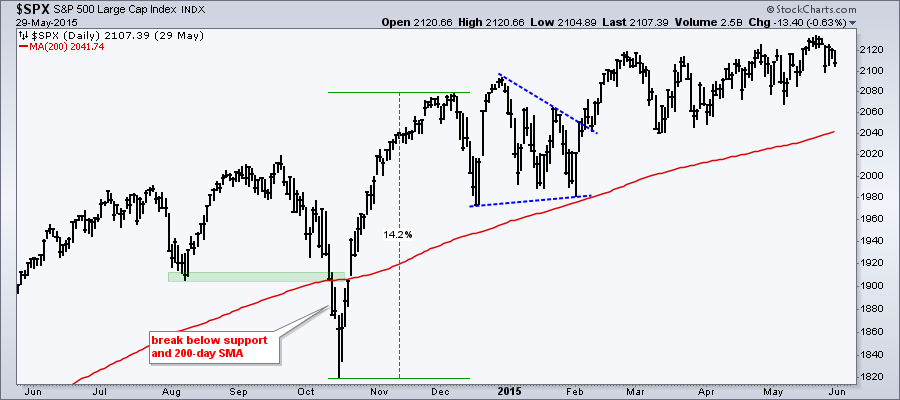 There was a shallow pullback after the surge with a falling flag taking shape in December. A three candlestick reversal formed with a long black candlestick, inverted hammer and long white candlestick. A gap-breakout completed the reversal, but SPY remained choppy for the next few months. This was a tough time for trading and culminated with a plunge in August 2015.
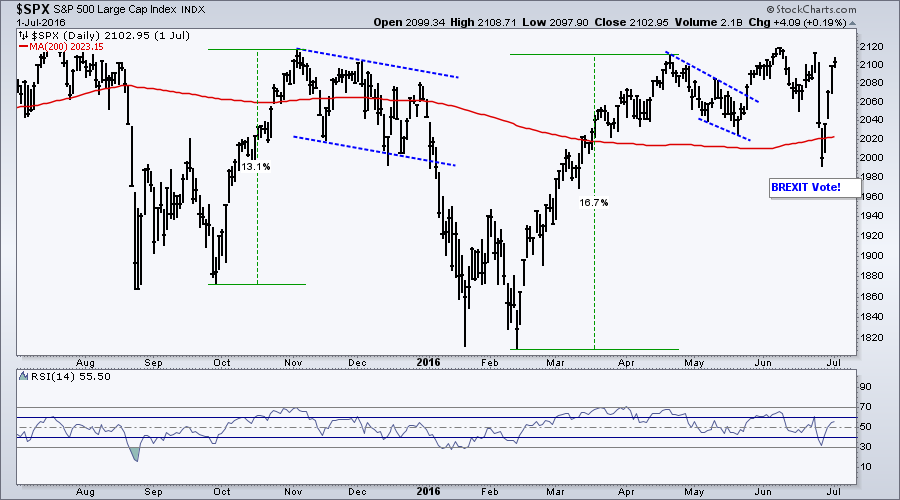
2015: Volatility and BREXIT Vote
The next chart shows two double digit surges in a short period. The S&P 500 corrected with a falling flag or channel after the first surge, but never broke out to signal a resumption higher. Thus, the bullish setup was there, but never confirmed. A bullish wedge formed after the second surge and the index broke out in late May. This breakout, however, was whipsawed with the surprise results from the Brexit vote.
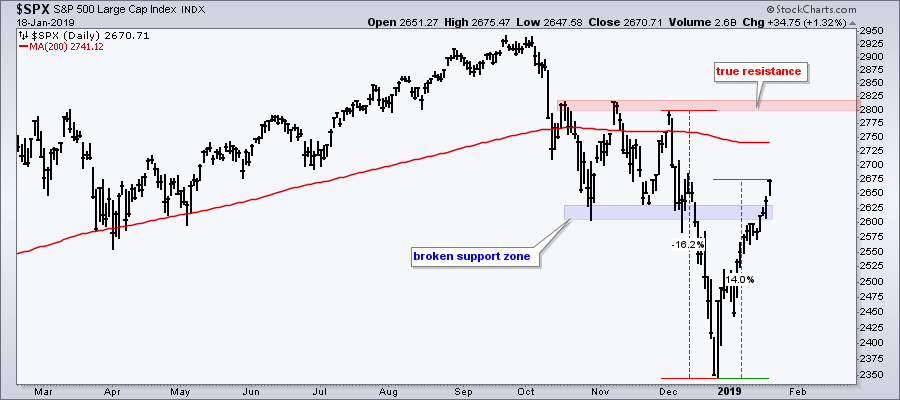
2019: What Now?
The S&P 500 surged some 14% over the last seventeen trading days (low to high). It is an impressive move on its own, but still in the shadow of the prior decline, which was 16%. The index did move back above the broken support zone, but I would not consider this "true" resistance. Prior highs mark "true" resistance because this is where the bulls actually failed. Prior support, in contrast, marks an area where the bears triumphed with a breakdown. The ability to move back above the support break is not really bullish. A break above the 200-day and the prior high, on the other hand, would be bullish.
If this bounce is the start of an extended bull run, I am perfectly happy to wait for a playable pullback. This means a 50-61% retracement, a bull wedge, a bull flag or some sort a candlestick reversal after a pullback. The key, for me at least, is to wait for a pullback because I am a second mouse kind of guy. The early bird gets the worm, but the second mouse gets the cheese.
Questions, Comments or Feedback?
I do not take symbol request and I cannot promise to response to all correspondence, but I will read it and take into under consideration. I greatly appreciate all feedback because it helps me improve the commentary and provides ideas for the future.

- Arthur Hill, CMT
Senior Technical Analyst, StockCharts.com
Book: Define the Trend and Trade the Trend
Twitter: Follow @ArthurHill


