- Extended but Not Overbought.
- SPY and QQQ Form Doji.
- %Above 20-day EMA Holds Strong.
- 4 Sector SPDRs above their 200-day SMAs.
- On Trend on StockChartsTV.
 ... The stock market is in a tricky spot because the short-term uptrends are quite extended and the long-term trends are still down. The chart below shows the big four indexes with their 50-day SMAs and 200-day SMAs. First and foremost, notice that the big four remain below their 200-day SMAs and below their early December highs. All four recorded 52-week lows in late December and their 50-day SMAs are below their 200-day SMAs. Thus, the evidence suggests that the long-term trends are still down for these four indexes.
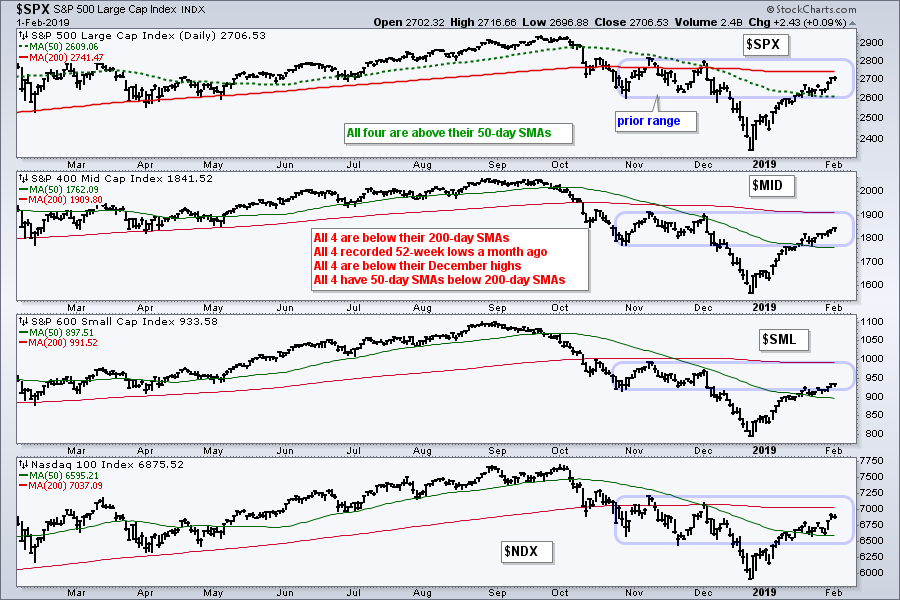
All four indexes are in short-term uptrends, but they are also trading in prior consolidation zones that could act as resistance. The lows from late October to late November marked prior support levels, while the highs from early November to early December marked resistance levels. Taken together, these zones mark battle zones that could give way to a short-term reversal in the major indexes.
Extended by Not Overbought
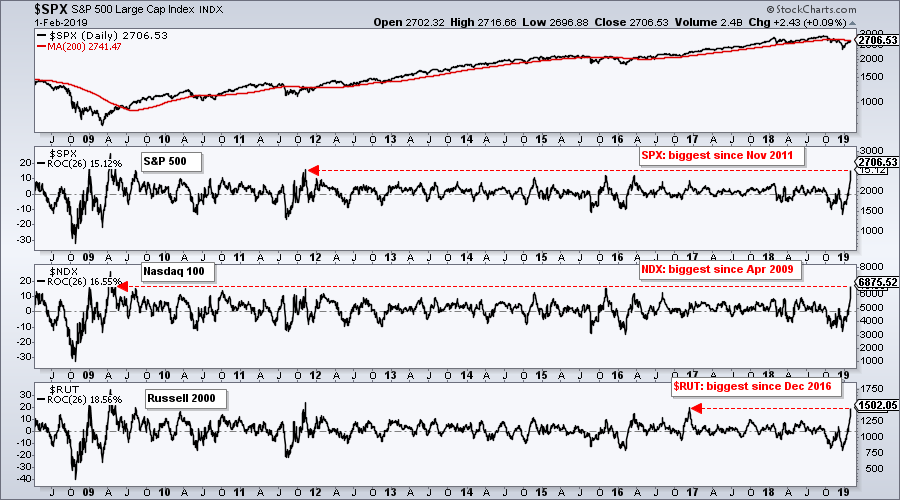
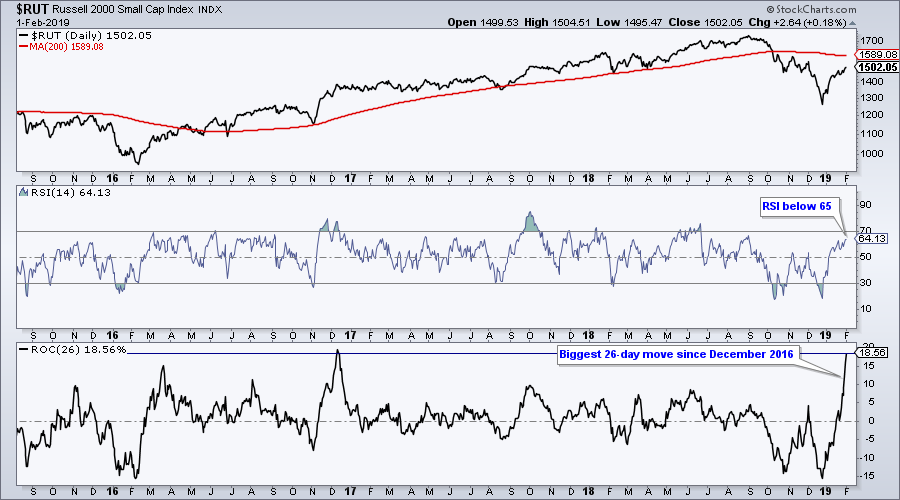
There is really no difference between the terms overbought and over-extended. They both suggest that a move has come too far too fast. The chart below shows the 26-day Rate-of-Change for the S&P 500, Nasdaq 100 and Russell 2000. $SPX is up 15%, $NDX is up around 16.5% and $RUT is up around 18.5%. The red lines show that these are the biggest 26-day move since November 2011 for $SPX, April 2009 for $NDX and December 2016 for $RUT.
Despite the biggest move in years, 14-day RSI for these three indexes has yet to exceed 65. Given the size of the advance and the short timeframe, I would expect RSI to be overbought. Things that make you go hmm... In fact, I would view an RSI reading above 70 as bullish because it shows strong upside momentum. The inability to clear 65 suggests that upside momentum is perhaps not that strong.
SPY and QQQ Form Doji
Despite long-term downtrends, the short-term uptrend holds the key right now. The bulls are holding their own as long as the short-term uptrends extend and/or short-term support levels hold. A short-term trend reversal within a bigger downtrend, however, could be quite negative.
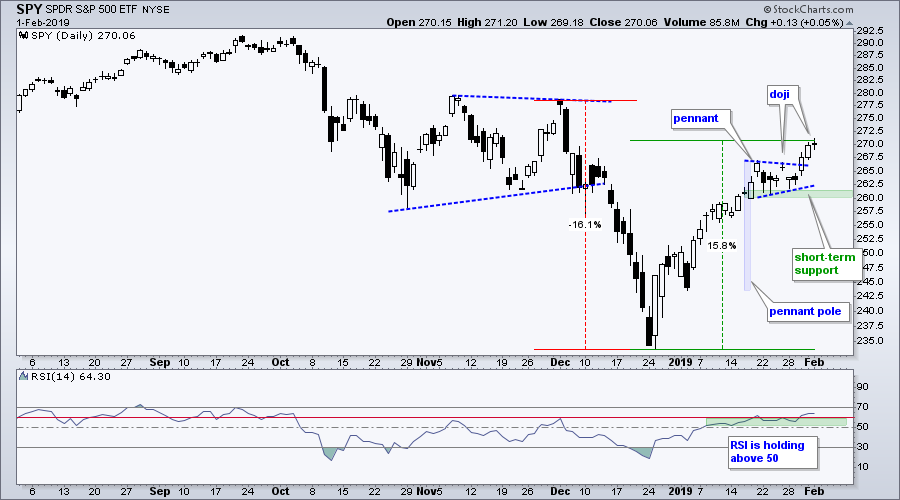
The S&P 500 SPDR (SPY) and Nasdaq 100 ETF (QQQ) formed pennants in late January and broke out with surges on Wednesday-Thursday. These breakouts are bullish until proven otherwise. For the second Friday in a row, SPY formed a doji and stalled. Doji signal indecision because price basically went nowhere the entire day. A sharp decline and close below 265 from current levels would put a short-term reversal in play. The pennant lows mark support and a break here would clearly reverse the short-term uptrend. The indicator window shows RSI and a break below 50 would signal a downturn in momentum.
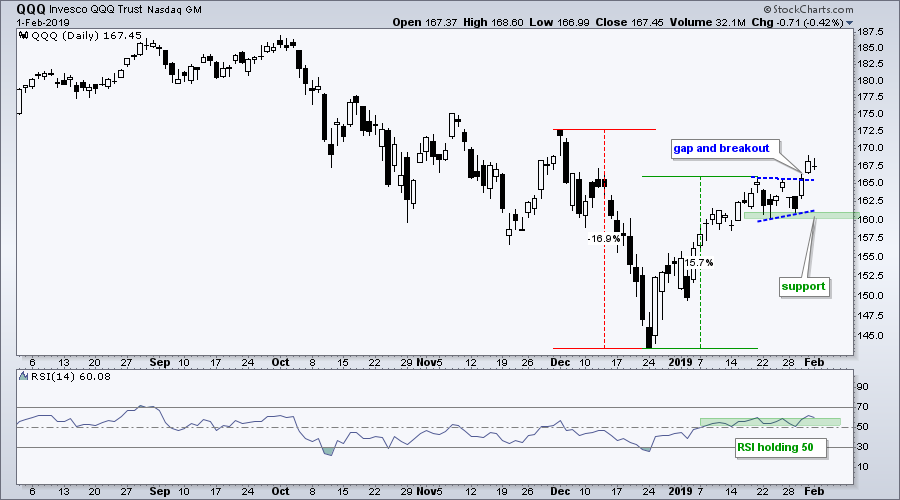
QQQ formed a doji and Friday's range was inside Thursday's range. Thus, QQQ formed an inside day or harami. These patterns signal indecision that can lead to a short-term reversal. A sharp decline and close below 165 would put a short-term reversal in play. Such a move would also fill Thursday's gap. As with SPY, the pennant lows mark support and RSI remains above 50. Watch these levels for a clear breakdown.
%Above 20-day EMA Holds Strong
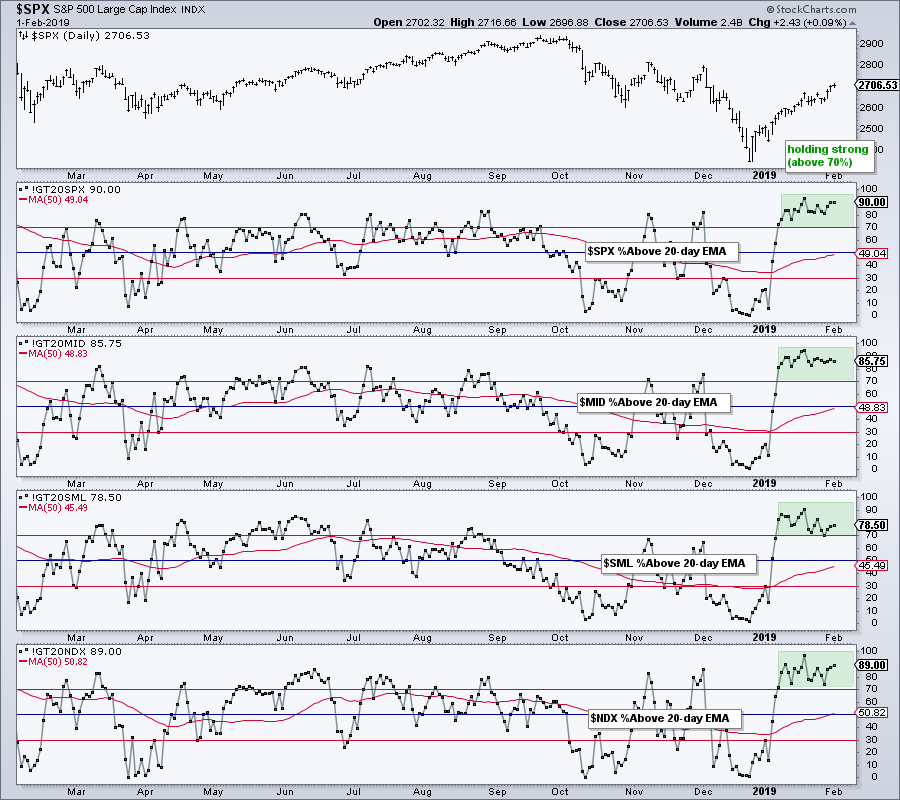
The Percentage of stocks above the 20-day EMA continues to hold up and this is another short-term indicator to watch closely going forward. %Above 20-day EMA remains above 70% for $SPX, $MID and $SML. In fact, these values range from 78.5% for the S&P Small-Cap 600 to 90% for the S&P 500. Overall, these indicators are holding up and supportive of the short-term uptrend. Watch for these to move below 70% to signal the start of a pullback.
4 Sector SPDRs above their 200-day SMAs
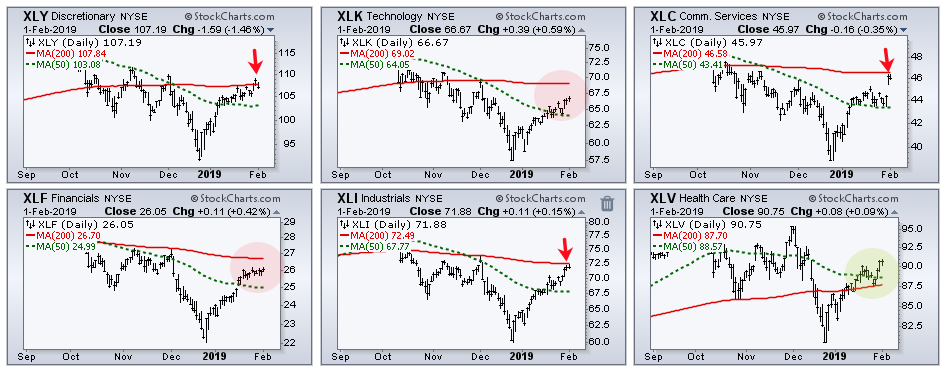
All eleven sector SPDRs are above their 50-day SMAs, but only four are above their 200-day SMAs. The Health Care SPDR, Utilities SPDR, Real Estate SPDR and Consumer Staples SPDR are above the 200-day SMAs (green shading). These four sectors are defensive in nature. Note that none of the "offensive" sectors are above their 200-day SMAs (industrials, technology, finance, consumer discretionary).
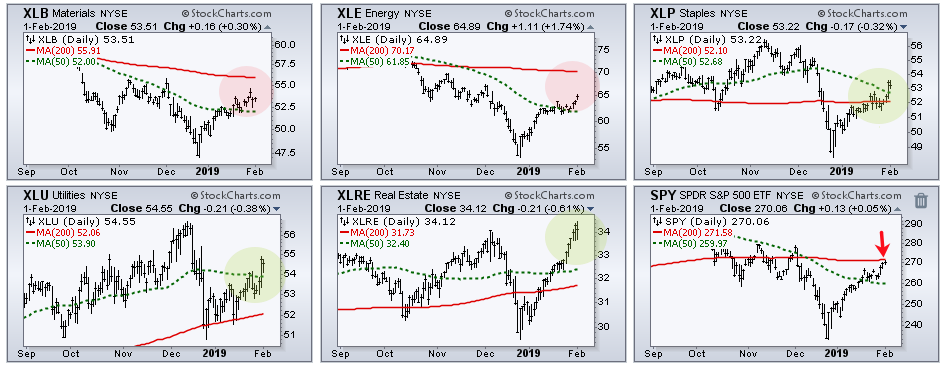
The red arrows show SPY, the Consumer Discretionary SPDR, the Communication Services SPDR and the Industrials SPDR right near their 200-day SMAs. Thus, this is a key test for these four sectors. The red shading shows the Financials SPDR, Technology SPDR, Materials SPDR and Energy SPDR below their 200-day SMAs. These four are the laggards overall.
On Trend on StockChartsTV
Note that On Trend can be seen on Tuesdays and Thursdays as 10:30AM and 11:00 AM ET on StockChartsTV. Shows are then archived on our Youtube Channel.
Questions, Comments or Feedback?
I do not take symbol request and I cannot promise to response to all correspondence, but I will read it and take into under consideration. I greatly appreciate all feedback because it helps me improve the commentary and provides ideas for the future.

- Arthur Hill, CMT
Senior Technical Analyst, StockCharts.com
Book: Define the Trend and Trade the Trend
Twitter: Follow @ArthurHill


