- Six of Nine Breadth Indicators Bullish.
- November 2015 All Over Again?
- JP Morgan, Bank of America and Citigroup Break Out.
- A Successful Test for Disney.
- ChartList Addition and Deletion.
- On Trend on YouTube.
Breadth Indicators Flip Back to Bullish
The S&P 500 turned net bullish on February 5th when two of the three breadth indicators crossed their bullish thresholds. The 10-day EMA of S&P 500 AD Percent ($SPXADP) turned bullish with a move above +30% on January 10th and the %Above 200-day EMA (!GT200SPX) turned bullish on February 5th with a move above 60%. S&P 500 High-Low% ($SPXHLP) was the lone holdout and it triggered bullish with a move above +10% on Friday, February 15th.
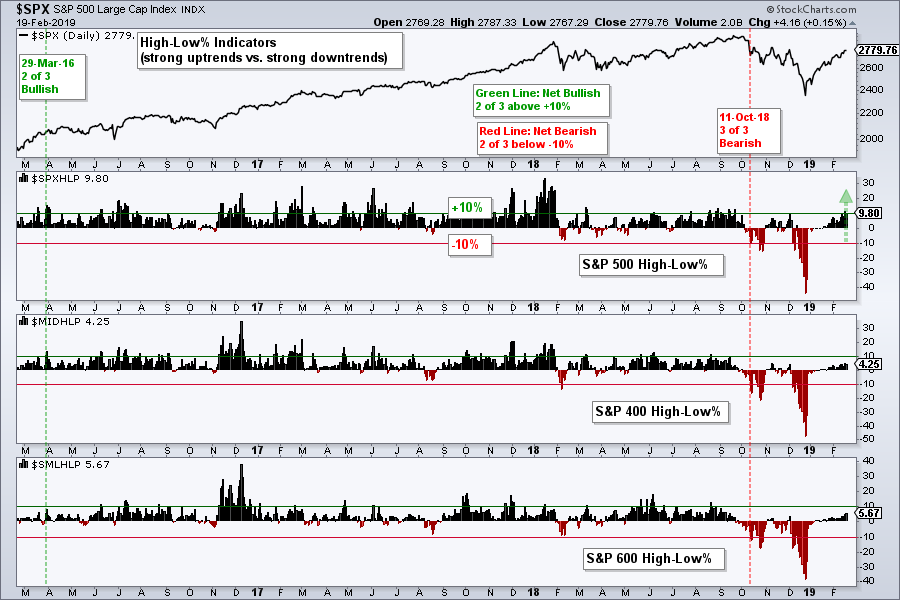 Two of the three breadth indicators are bullish for the S&P Mid-Cap 400 and one of the three breadth indicators is bullish for the S&P Small-Cap 600. All told, this means six of the nine breadth indicators are net bullish. Thus, the bearish signal from October 11 has been reversed. Here is a chart for the AD Percent indicators and here is a chart for the %Above 200-day EMA indicators. Also note that I updated the index and sector indicator tables on Friday (here).
November 2015 All Over Again?
As far as the broader market is concerned, the biggest worry is that this is November 2015 all over again (red zone). The weekly chart below shows the S&P 500 plunging in August 2015, surging back to the prior highs in November and then testing the summer lows with a sharp decline in January 2016. I would note that only four of the nine breadth indicators were bullish in November 2015. Thus, five of nine were still bearish and did not support the surge.
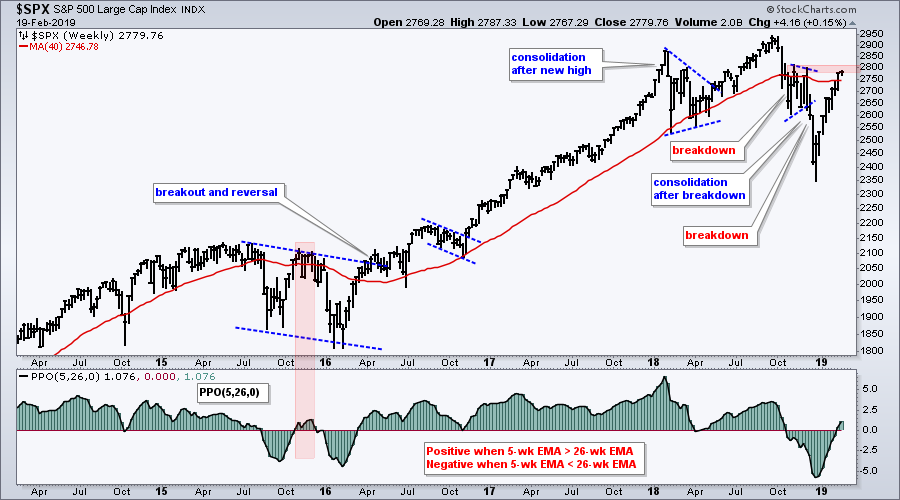
As with November 2015, the S&P 500 is back above its 40-week SMA and the PPO(5,26,0) is positive again. Yes, there is possible resistance from the October-December highs. This time, however, six of the nine breadth indicators are bullish. It is not an overwhelming signal, but the bulk of the current evidence is more bullish than bearish. Let's not look for something that is not there. At this point, I will simply accept the writing on the wall and take it one day/week at a time.
Third Biggest Sector Clears 200-day
The Financials SPDR (XLF) is the third biggest sector in the S&P 500 (13.37%) and one of the lagging sectors over the last three, six and twelve month periods. The Regional Bank SPDR (KRE) and Bank SPDR (KBE), however, are two of the top performing groups year-to-date. Both are up more than 20% this year. Perhaps XLF has too many non-banks than these pure banking ETFs. XLF gets all the attention because it is one of the eleven sector SPDRs.
The chart below shows XLF surging to the 200-day SMA, stalling for a few weeks and breaking out with an advance over the last five days. It looks like a flat flag and this breakout signals a continuation of the prior surge. A close below 25.5 would call for a re-evaluation.
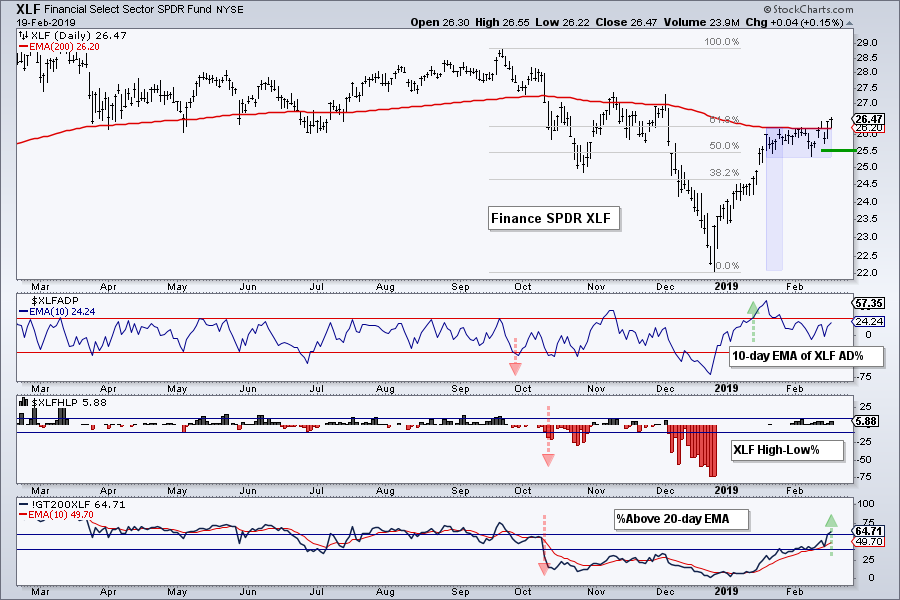
The lower windows show the three breadth indicators. The 10-day EMA of XLF AD Percent ($XLFADP) reversed its bearish signal with a surge above +10% on January 14th. XLF High-Low% ($XLFHLP) remains on a bearish signal (red arrow). The Finance %Above 200-day EMA (!GT200XLF) reversed its bearish signal with a move above 60%. Thus, two of the three are on bullish signals and the cup is half full for finance.
JP Morgan, Bank of America and Citigroup Break Flags
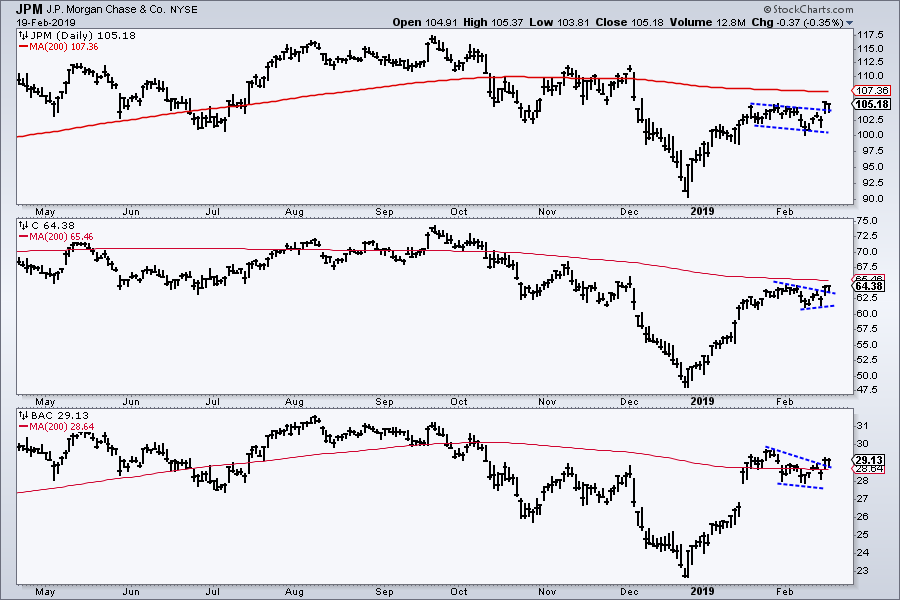
The big three of banking are leading the two day surge with gaps and consolidation breakouts. Notice that all three gapped up on Friday and broke out of their consolidation patterns. These patterns formed after a sharp advance and represent bullish continuation patterns. JPM hit a new high for the year (2019) on Friday and BAC is back above its 200-day SMA. I would consider these breakouts valid as long as Friday's gaps hold. A close below these gap zones would warrant a re-evaluation.
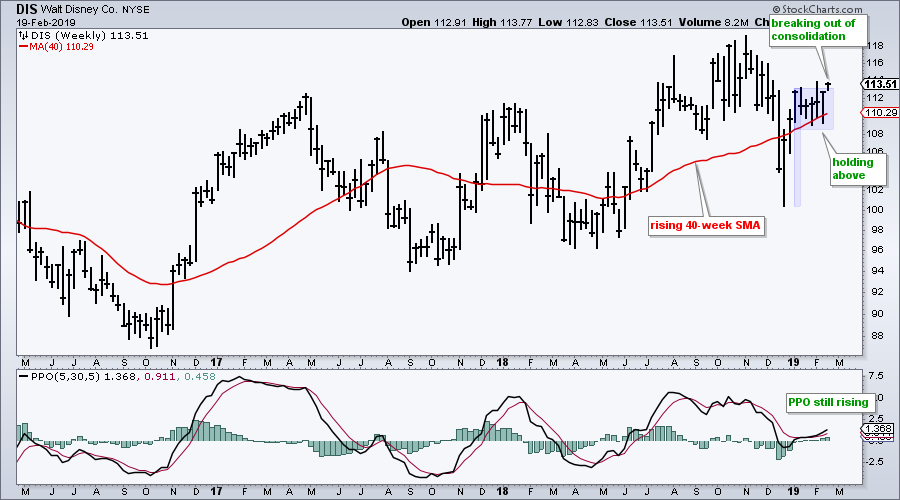
A Successful Test for Disney
The big trend for Disney is up as the stock hit a 52-week high in October and price is back above the rising 40-week SMA. After a surge above the 40-week SMA, the stock consolidated for four weeks and closed between 111 and 112 four Fridays in a row. The stock dipped below the 40-week SMA twice over the last five weeks, but did not close below and kept the uptrend alive. With a strong close last week (above 112) and further gains this week, it looks like DIS is ready to resume its bigger uptrend. Also notice that the PPO (5,30,5) is still rising.
ChartList Updates
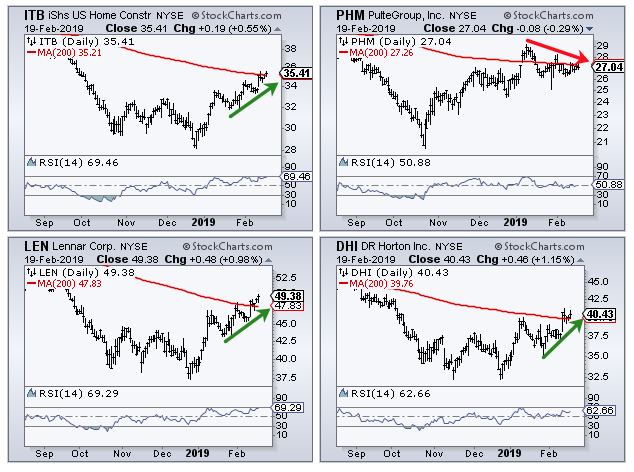
I will add DIS to the Art's Charts ChartList. I am removing Pulte Home (PHM) because it underperformed the market in February and its group, the Home Construction iShares (ITB). LEN and DHI are above their late January highs, but PHM is not keeping pace. Click here for the Art's Charts ChartList.
On Trend on YouTube
Finance and Biotech ETFs Break Out
- Changing of the Guard (Low Vol in Vogue)
- Finance Sector Springs to Life (XLF and 4 stocks)
- Flags Flying at Regional Banks (KRE and 4 stocks)
- Biotech Breakouts (IBB, XBI and 5 stocks)
- China, Korea and Vietnam Lead Asia
- Click here to Watch
- Arthur Hill, CMT
Senior Technical Analyst, StockCharts.com
Book: Define the Trend and Trade the Trend
Twitter: Follow @ArthurHill


