- Mid-caps and Small-caps Join Large-caps.
- Breadth Tables Improve.
- XLU Shows Strongest Breadth.
- Changing My Mindset.
- Home Construction iShares Clears 200-day.
- Three Flags at Different Breakout Stages.
- Pfizer Gets Second Breakout.
- Berry Plastics Completes Big Reversal.
- Expedia Breaks Channel.
- ChartList Notes and Deletions.
 ... Mid-caps and Small-caps Join Large-caps
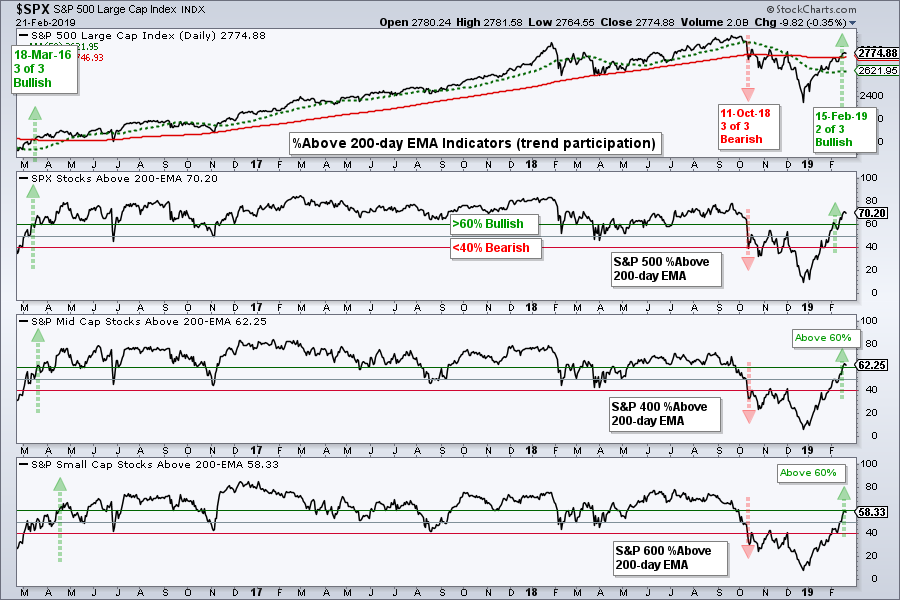
... The Mid-Cap %Above 200-day EMA (!GT200MID) and the Small-Cap %Above 200-day EMA (!GT200SML) joined the S&P 500 %Above 200-day EMA (!GT200SPX) with moves above 60% this week. This is the bullish threshold for these indicators and all three are now on bullish signals. These bullish signals reverse the bearish signals from October 11th. Thus, the majority of stocks in these three indexes are above their 200-day EMAs and this is more bullish than bearish.
Breadth Tables Improves
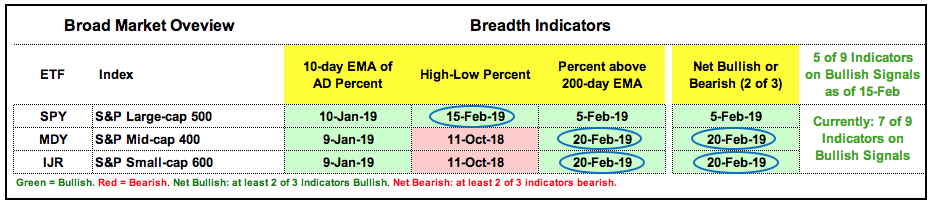
The image below shows the indicator table for the three major indexes. S&P 500 High-Low% ($SPXHLP) moved above +10% on February 15th to turn bullish and flip the table from net bearish to net bullish (5 of 9 indicators on bullish signals). With two more bullish signals triggering this week, seven of the nine indicators are on bullish signals and the market environment is net bullish.
The next image shows the indicator table for the eleven sectors with the blue ovals highlighting new signals this week. Of note, Finance %Above 200-day EMA (!GT200XLF) exceeded 60% this week and this signal turned the finance sector net bullish. XLF High-Low% ($XLFHLP) is still short of a signal, but we saw some bullish price action in the XLF this week. All told, ten of the eleven sectors are net bullish and the Energy SPDR is the only bearish sector. There are still some pockets of weakness within the Communication Services SPDR and Consumer Staples SPDR because they are not keeping pace in the new highs category.
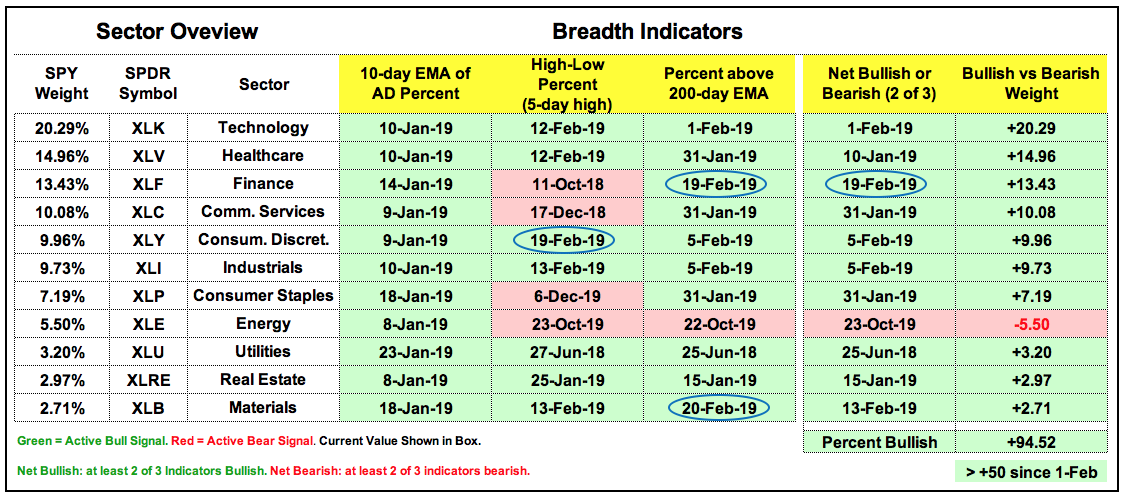 The last column totals the sector weightings that are bullish. The sum total is at 94.52% because only XLU (5.50%) is not bullish. Note that sector weightings turned net bullish on February 1st, when the percentage of bullish sectors exceeded +50% for the first time. Note that these sector breadth indicators only apply to stocks in the S&P 500 and the S&P 500 breadth indicators turned net bullish on February 5th (two of three indicators on bullish signals).
XLU Shows Strongest Breadth
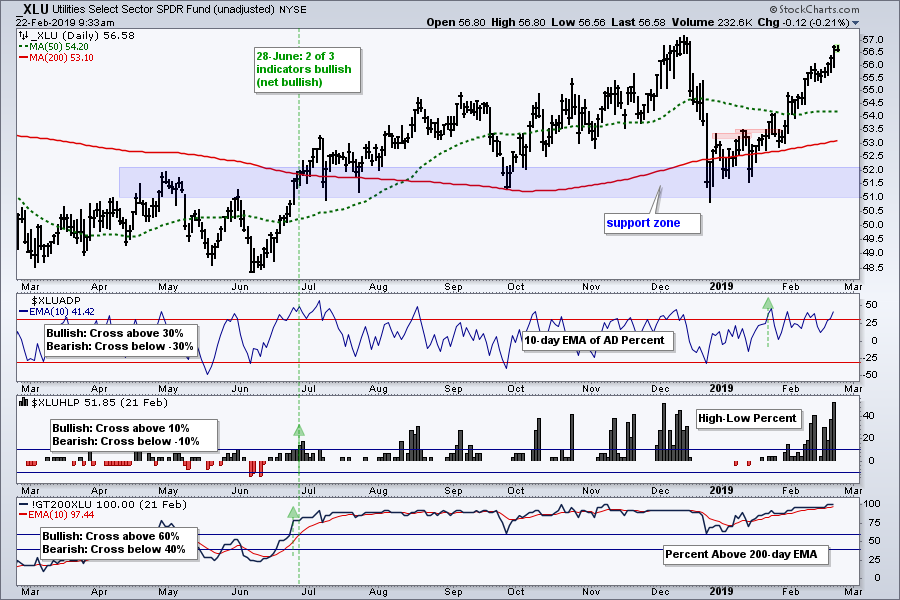
The chart below focuses on the three breadth indicators for the Utilities SPDR and the top window shows the unadjusted price chart for XLU (_XLU). Unadjusted is without dividends. First, note that two of the three indicators turned net bullish on June 28th (green line). Second, notice that Utilities %Above 200-day EMA (!GT200XLU) has not been below 60% since late June. Third, notice that XLU High-Low% ($XLUHLP) regularly exceeded +20% from August to February. On the price chart, unadjusted XLU bounced off support in late December and triggered two resistance breaks in January (red zones).
Leadership from the Utilities SPDR is not necessarily negative for the broader market. XLU accounts for a whopping 3% of the S&P 500 and it does not take much money to move this sector. Sure, leadership shows a preference for defensive names and low volatility, but that is about as far as it goes as far as I am concerned. As the sector table shows, XLU is not the only strong sector. The trouble in the stock market starts when the big sectors start showing absolute weakness, not relative weakness. The market can move higher as long as the majority (50+1 percent) of sectors are bullish (strong price charts and strong breadth). The trouble starts when we see price and breadth weakness in 50+1 percent of the sectors.
Changing the Mindset
With the bulk of the evidence bullish for stocks, I will be changing my mindset towards support and resistance. The breadth indicators are net bullish and the S&P 500 is above its 200-day SMA. While the index could certainly move back below this moving average and even correct with a pullback to the 50-day SMA (-5.5%), I will now view pullbacks as opportunities instead of threats. Furthermore, I will NOT be marking resistance levels at the November-December highs and certainly not at the September-October highs. Resistance levels are moot in an uptrend or bullish environment because rising prices and higher highs are expected. A trend in motion is expected to stay in motion.
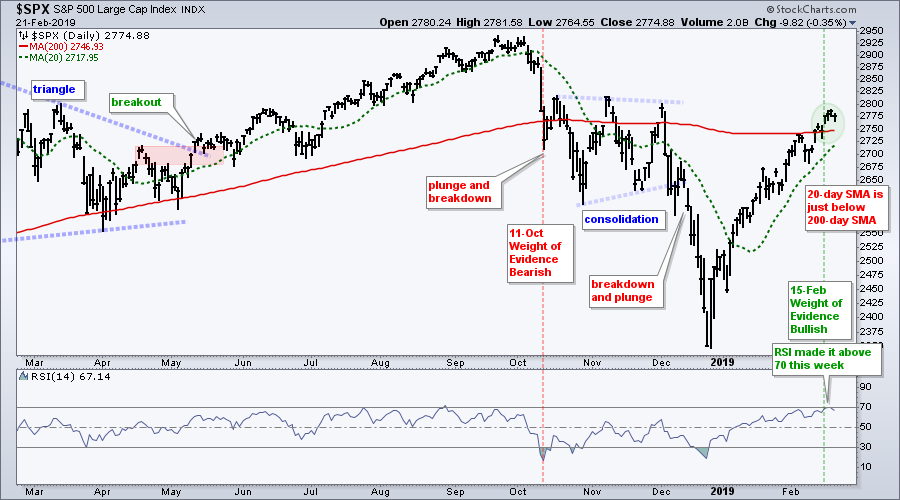
Do I expect a move above the September high? Yes, as long as the bulk of the evidence remains bullish. Will it be a straight line? I doubt. We will probably see a correction sooner rather than later. Could I be wrong? Yes. The only thing I can do is weigh the evidence and accept the result until proven otherwise.
Home Construction iShares Clears 200-day
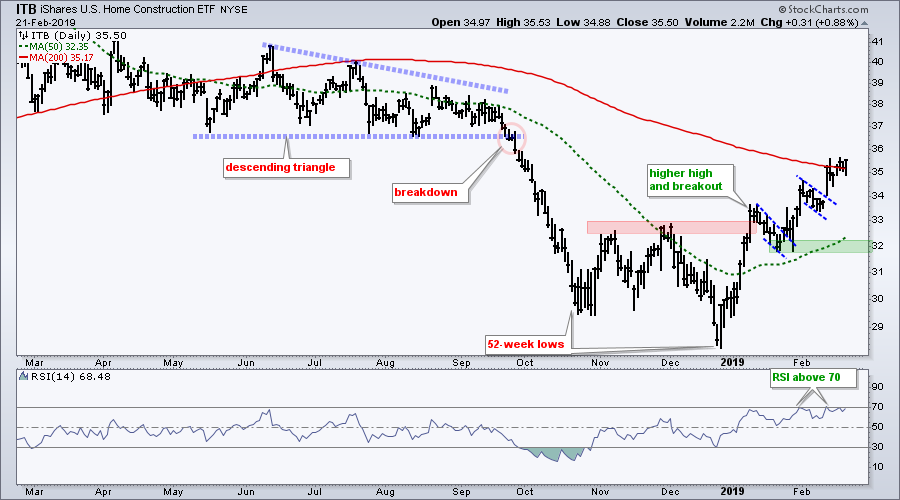
The Home Construction iShares (ITB) continues to lead with a move above its 200-day SMA this week. The ETF extended on its mid January breakout with a pair of falling flag breakouts and remains strong. I will leave key support in the 32 area for now. It would seem logical to say that upside leadership from housing is positive for the broader market, but SPY was hitting new highs in late September when ITB was hitting new lows. Thus, a downtrend and relative weakness in ITB did not negatively affect the S&P 500 last year.
Three Flags at Different Breakout Stages
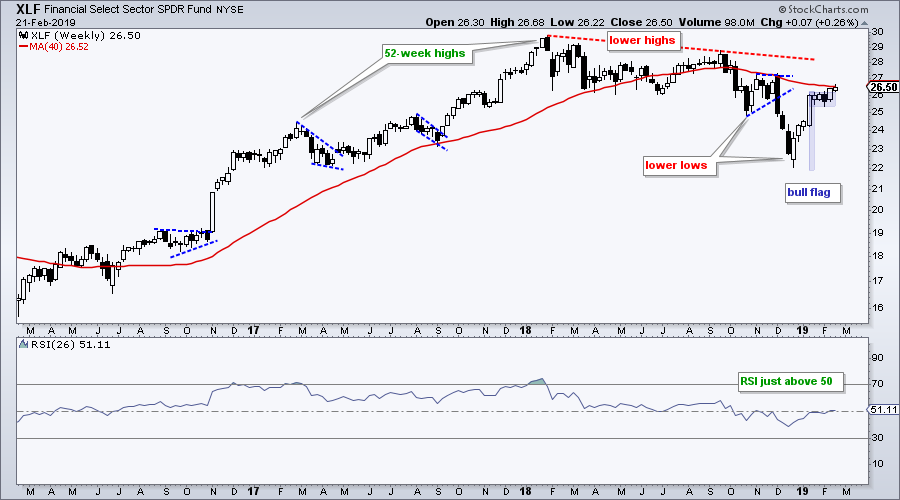
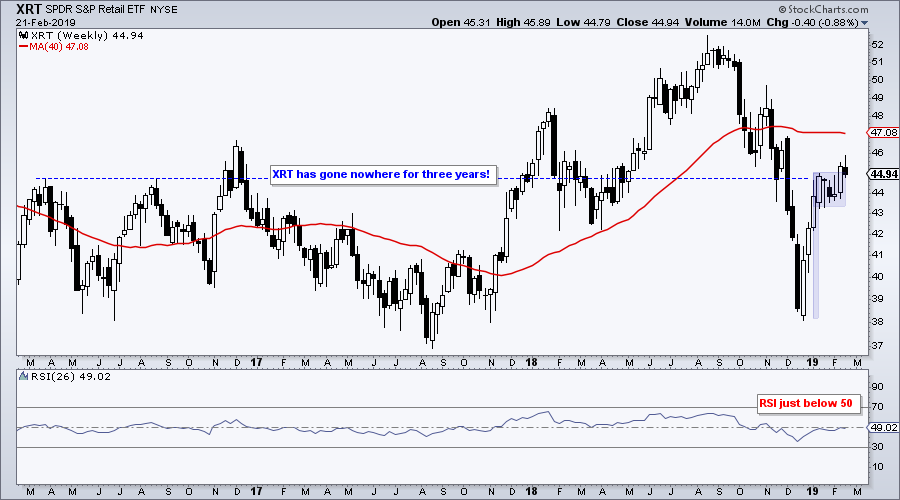
I highlighted bull flags in the Financials SPDR (XLF), Retail SPDR (XRT) and Biotech iShares (IBB) last week and all three broke out last Friday. XLF is stalling above its breakout zone, XRT fell back a little and IBB fell back a lot. XLF is clearly the strongest of the three.
The chart below shows XLF breaking out of a flag pattern last week and holding this breakout with a stall in the 26.5 area this week. The ETF is also right below the falling 40-week SMA (2 cents) and 26-week RSI is just above 50. The falling flag breakout is bullish until proven otherwise and I would re-evaluate on a close below 25.50. XLF is the third largest sector and a failed breakout would weigh on the broader market.
XRT broke out with a surge last week and then fell back a little this week. The breakout is holding for the most part and I would re-evaluate on a close below 44.
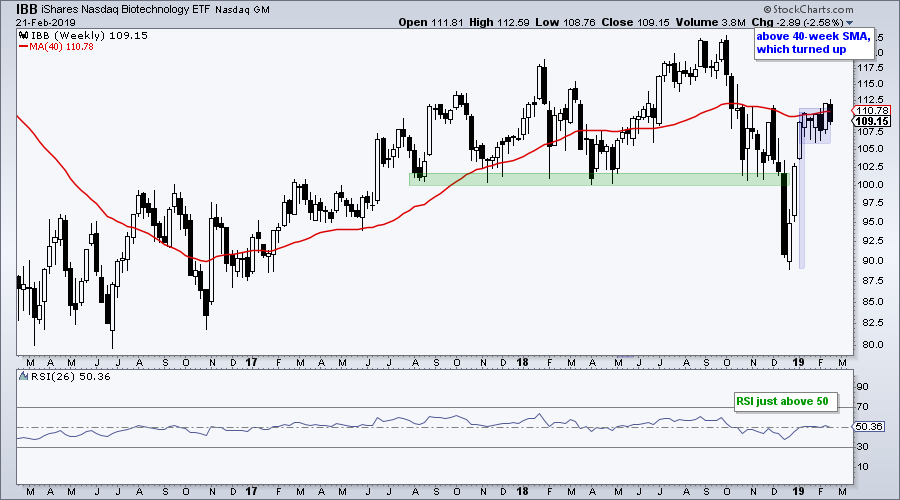
IBB was hit hard on Thursday as several big biotech stocks fell sharply (BIIB -4.17%, VRTX -2.54%, GILD -2.13%, ILMN -1.77%). Only a handful of IBB stocks were higher on Thursday. While the flag breakout is under threat with this week's decline, biotech stocks are a volatile bunch so this may be just noise. The 40-week SMA is still rising and 26-week RSI is barely above 50. A close below 107 would warrant a re-evaluation.
Pfizer Gets Second Breakout
The next three stocks will be added to the Art's Charts ChartList. Note that I take a shotgun approach to stock picking and portfolios. The overall strategy and the aggregate are more important than the individual picks. Some picks will succeed and some will fail. Hopefully, the successes will pay for the failures, and then some.
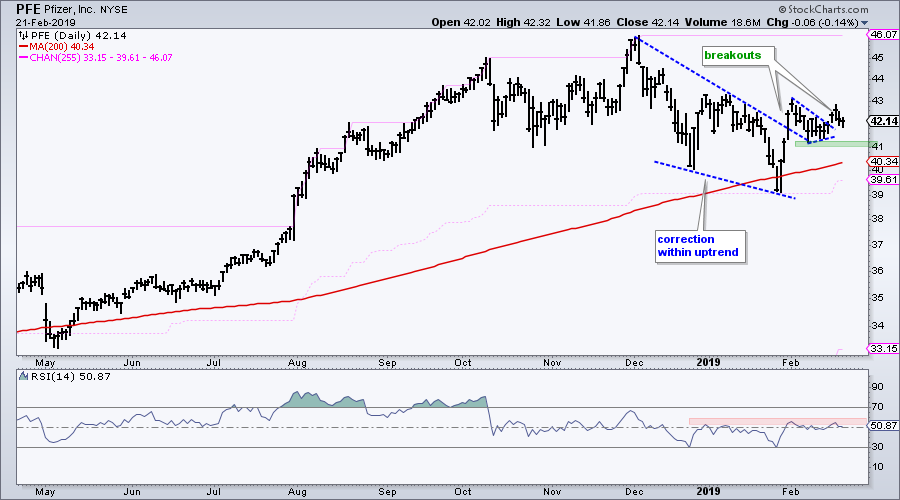
The first new addition to the ChartList is Pfizer (PFE). The stock is hit a 52-week high in November and is above its rising 200-day SMA. A falling wedge formed into late January and this is a corrective pattern within the bigger uptrend. PFE broke out with a surge in late January, stalled for two weeks and broke out of a pennant last week. I will put initial support at 41.
Berry Plastics Completes Big Reversal
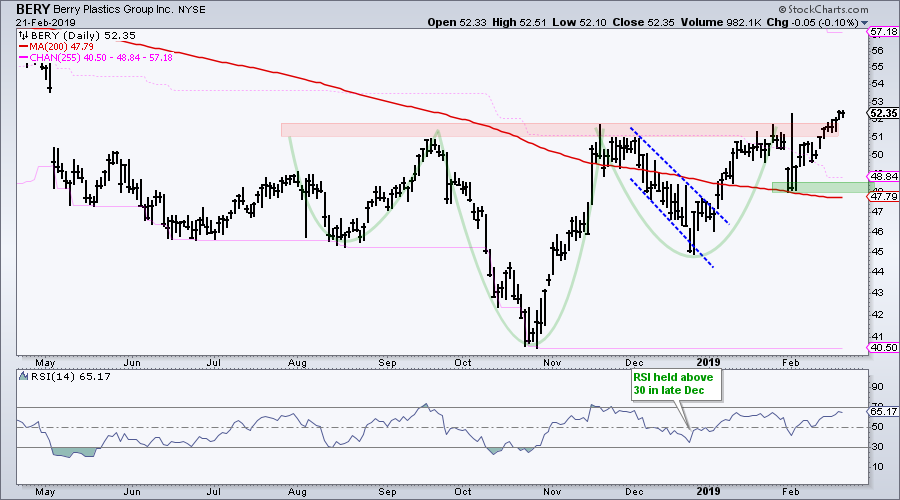
The next new addition is Berry Plastics (BERY), which just broke out of a large inverse head-and-shoulders pattern. Like most patterns, it is not picture perfect, but there is a clear basing process over the last seven months and a break above the resistance zone. I will set initial support at 48.
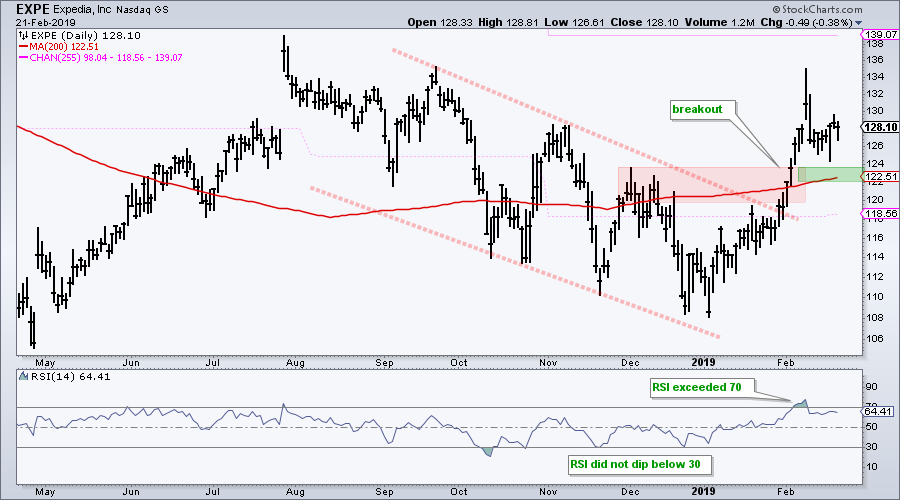
Expedia Breaks Channel
The next new addition is Expedia (EXPE), which broke out of a falling channel and exceeded its December highs. The stock fell back in February, but remains above the breakout zone and above the rising 200-day EMA. I view this as a "throwback" after the breakout and expect broken resistance to hold. A close below 122 would call for a re-evaluation.
ChartList Notes and Deletions
The Art's Charts ChartList has been updated with support levels and some comments on the charts. Next week I will likely remove some of the international ETFs to make room for individual stocks. Recent changes include:
DIS added 2/20/2019
PHM removed 2/20/2019
PHM added back 2/22/2019
Yeah, I went back and forth on PHM. Never really had reason to remove the stock because it was holding support, even though it was underperforming its peers. The group remains strong and the stock bounced off support with a weak tape on Thursday. Back on the ChartList it goes.
Walgreens-Boots (WBA) surged above resistance and then fell back hard over the last two days. Watch this one closely because the breakout failed and support is close at hand.
New Additions today: PFE, BERY, EXPE
Click here for the Art's Charts ChartList
Questions, Comments or Feedback?
I do not take symbol request and I cannot promise to response to all correspondence, but I will read it and take into under consideration. I greatly appreciate all feedback because it helps me improve the commentary and provides ideas for the future.

Plan Your Trade and Trade Your Plan.
- Arthur Hill, CMT
Senior Technical Analyst, StockCharts.com
Book: Define the Trend and Trade the Trend
Twitter: Follow @ArthurHill


