 The 200-day moving average is perhaps the most widely used moving average and the S&P 500 is the most widely followed benchmark for the U.S. stock market. Taken together, the S&P 500 and the 200-day SMA can be used to identify major trends in the broader market, but not without whipsaws and bad signals. Today we will put the 200-day to the test and show some techniques to reduce whipsaws and improve performance. There is also a link to Thursday's show, On Trend, which dives further into testing for the 200-day SMA.
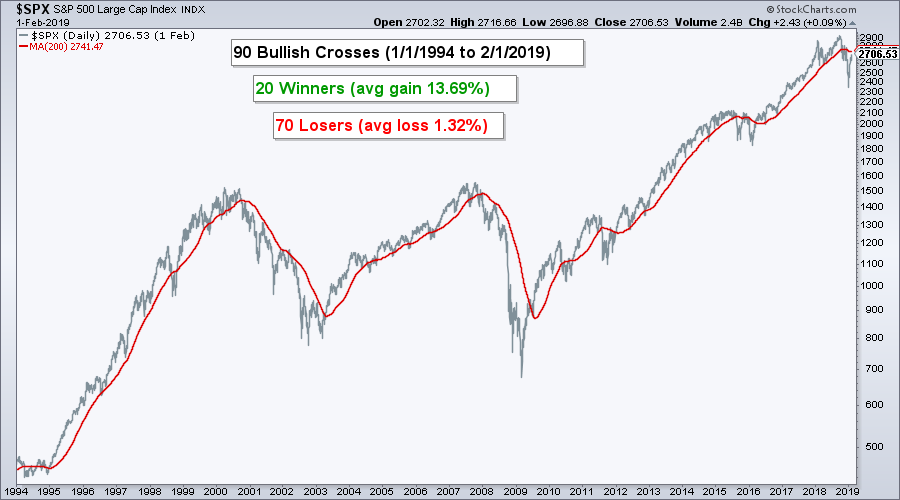
The chart below shows the S&P 500 with the 200-day SMA in red. The index crossed this key moving average some 180 times from January 1994 to January 2019. That averages out to around 7 crosses per year. There were 90 completed bullish signals during this time period. This involves buying when the S&P 500 crosses above the 200-day and selling when the index crossed below the 200-day SMA. Of these signals, there were 20 winners with an average gain of 13.69% and 70 losers with an average loss of 1.32%. The winners outpaced the losers overall, but there were a lot of whipsaws.
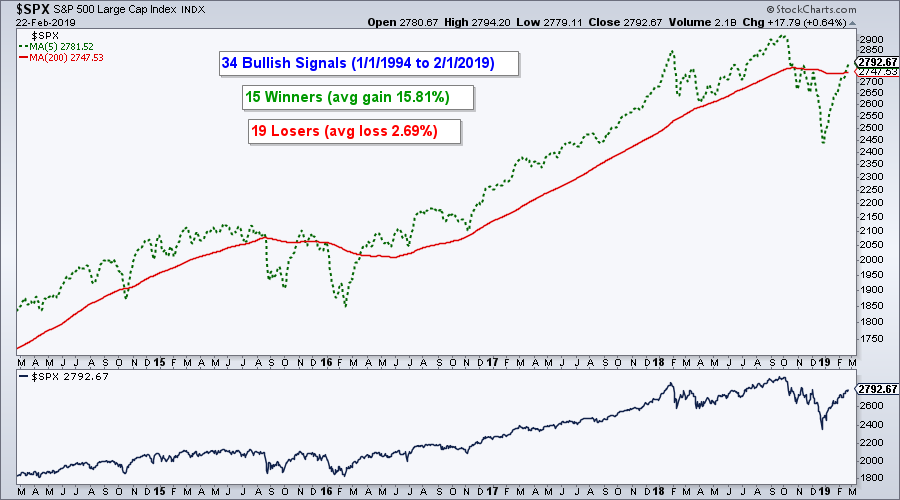
Chartists can seriously reduce whipsaws by using a 5-day SMA instead of the closing price. Thus, a bullish signal triggers when the 5-day SMA crosses above the 200-day SMA. Adding this simple smoothing technique resulted in just 34 bullish signals over the last 25 years. In addition, the average gain per signal increased and the number of losing signals decreased significantly.
Thursday's show, On Trend, expanded on this testing and crunched the numbers with backtesting. I tested a 20/200 day combination and a 50/200 day combination. I also tested a moving average crossover system for five other major indexes. The Nasdaq 100 tested pretty good, but the Dow Industrials and Russell 2000 did not fare well at all. I also tried applying signals from the S&P 500 to these indexes and the results were rather surprising.
On Trend on YouTube
Market Timing with the 200-day SMA
- 25-year Test of $SPX and 200-day SMA.
- Techniques to Reduce Whipsaws.
- Simple versus Exponential Moving Averages.
- Moving Average Signals for Other Indexes.
- Applying $SPX Signals to Other Indexes (and SPY).
- Dealing with Dividend Drift Why Use Market Timing?
- Click here to Watch
- Arthur Hill, CMT
Senior Technical Analyst, StockCharts.com
Book: Define the Trend and Trade the Trend
Twitter: Follow @ArthurHill


