 Another Obvious Resistance Level
If the S&P 500 declines from current levels, we will be able to look back at this level and see it as an "obvious" resistance level. Ain't hindsight great! Keep in mind, however, that this is the third "obvious" resistance level this year. The chart below shows the index with resistance levels in the 2600-2650 area, 2725 area and now the 2800 area. Third time lucky?
Admittedly, I was on the bandwagon thinking the index would hit resistance in the 2600-2650 area and turn back. This area marked broken support, a 61.8% retracement of the December decline and 50% retracement of the October-December decline. Despite this classic setup, there was no turning point here as the index continued on to the next resistance level. The 200-day SMA and a 61.8% retracement of the October-December decline marked next resistance in the 2725-2750 area.
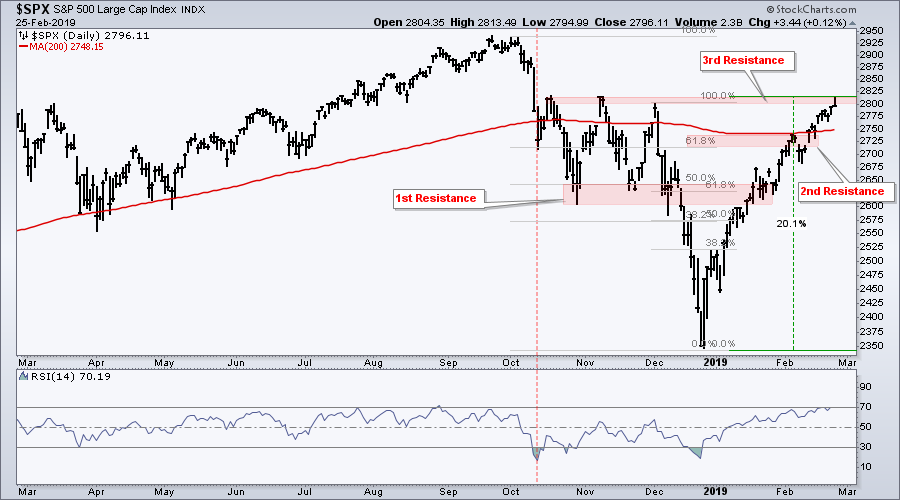
Once again, the index kept calm and carried on above its 200-day SMA to throw cold water on yet another resistance level. This brings us to the third obvious resistance level, which is marked by peaks in October, November and December. We can also note that RSI(14) became overbought with a move above 70. Thus, a pullback or decline from current levels seems to be the trade du jour.
Minimal Selling Pressure
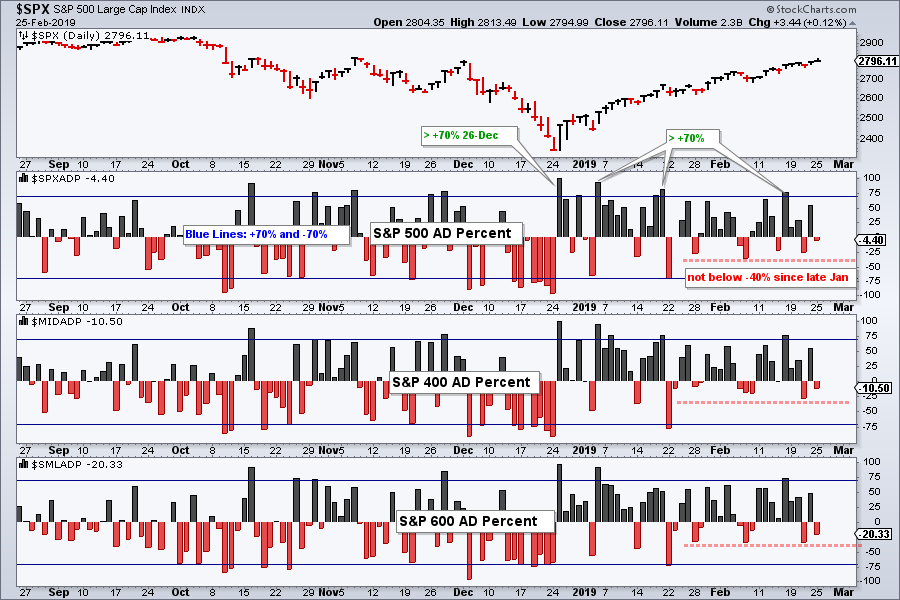
I do not know if resistance will hold the third time around and if we will finally see some selling pressure. I do know that selling pressure has been minimal since late January as AD Percent for the major indexes has not dipped below -40% (red dashed lines). The chart below shows S&P 500 AD Percent ($SPXADP) with multiple moves above +70% since December 24th and not one dip below -70%.
Majority of Stocks in Short-term Uptrends
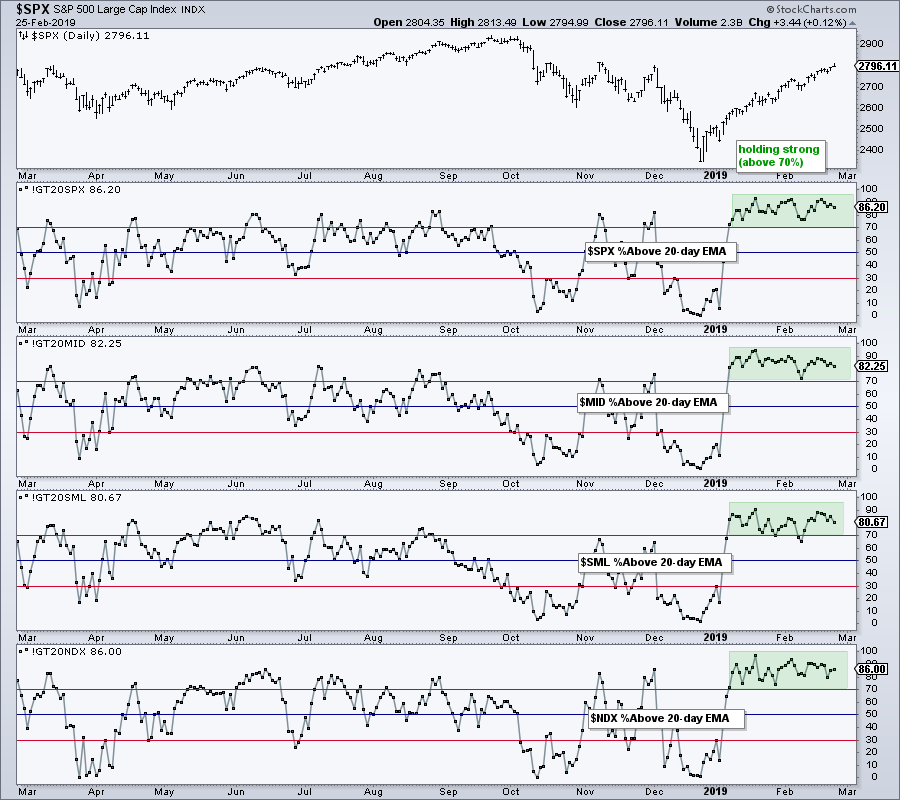
Looking at the Percentage of Stocks above the 20-day EMA for the major index ETFs, we can see that all four are above 70%. The S&P 500, S&P Mid-Cap 400 and Nasdaq 100 have been above 70% since January 8th. The S&P Small-Cap 600 dipped below 70% twice, but rebounded back above this level quite quick.
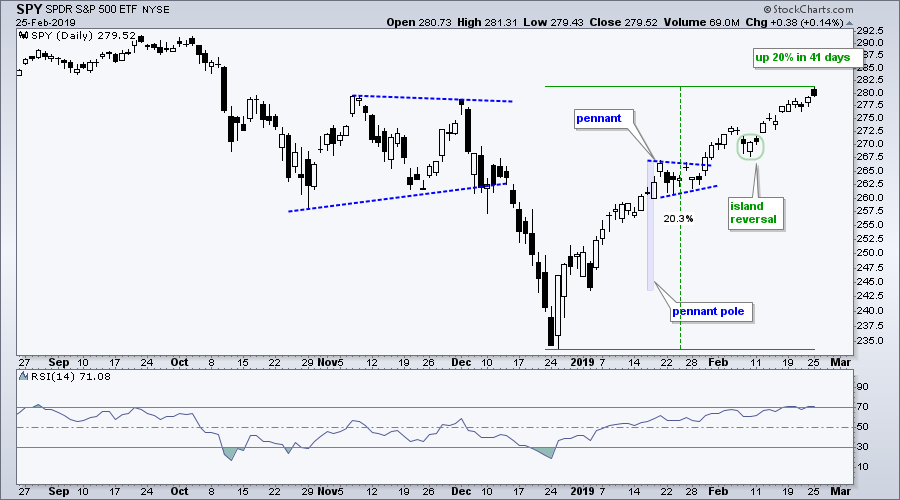
At this point, the short-term trend is up and extended, but I do not see any signs of significant selling pressure or weakening breadth. The bears see obvious resistance and overbought conditions, which could bear fruit. With the index up 20% in eight weeks, the odds favor some sort of rest sooner rather than later. When exactly is anyone's guess.
ChartList Updates
I am making some changes to the Art's Charts ChartList. These are not positions per se, but they are bullish setups or trends that I am following. While I do not see any evidence of a short-term top in the stock market (S&P 500), the index is up sharply over the last eight weeks and we could see a corrective period in the coming weeks. This may be a good time to lighten up and prepare for bullish setups should we get a pullback. Discretion is sometimes the better part of valor.
- AVGO 26-Feb: removing because it looks vulnerable to pullback.
- VMW 26-Feb: removing because is up 18% in 18 days.
- CYBR 26-Feb: removing because it is up 40% in four weeks.
- FIVN 26-Feb: removing because it looks vulnerable to a pullback.
- PFPT 26-Feb: removing because it was added after the gap and I would prefer to wait for a better setup.
- QLYS 26-Feb: removing because stock may need time to settle after big gap down.
- ZS 26-Feb: removing because stock has not moved since being added and earnings are Thursday. Risk is high and could go either way.
- Click here for the Art's Charts ChartList.
On Trend on YouTube
Potential Resistance versus Existing Uptrend
- Third Time Lucky for Resistance?
- Breadth/Trend Indicators Remain Strong
- Breaking Down the SPY and QQQ (top stocks)
- Bond ETFs are Winding Up (Bollinger Bands)
- XLC and XLE are the Lagging Sectors
- Tesla Seriously Underperforming Auto Group
- Click here to Watch
- Arthur Hill, CMT
Senior Technical Analyst, StockCharts.com
Book: Define the Trend and Trade the Trend
Twitter: Follow @ArthurHill


