- Triple 90% Down Volume Day.
- Breadth Table Update.
- Four Steps Up and One Step Back.
- SPY Hits Support and Becomes Oversold.
- Interest in Tariffs and Fed.
Triple 90% Down Volume Day
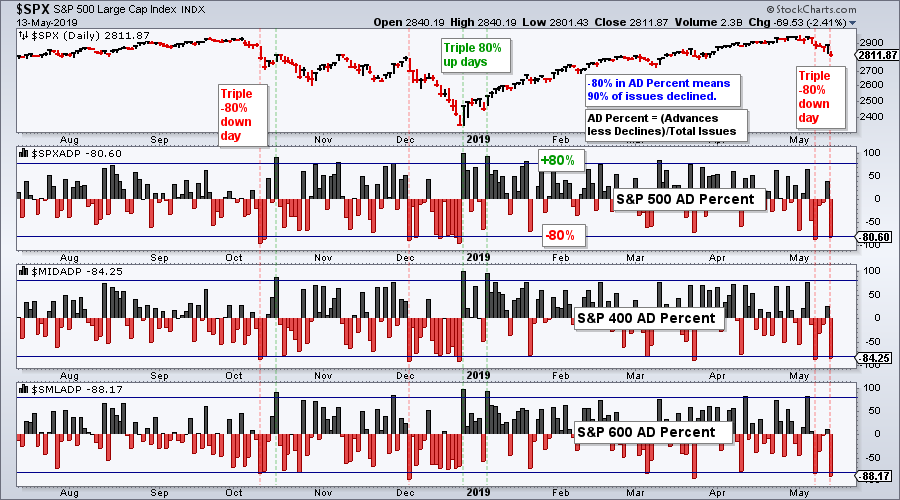
Stocks were hit with strong selling pressure again on Monday with the S&P 500 SPDR falling 2.5%, the Nasdaq 100 ETF plunging 3.5% and the Russell 2000 iShares losing 3.2%. Advance-Decline Percent for the S&P 500, S&P Mid-Cap 400 and S&P Small-Cap 600 exceeded -80% for the second time in as many weeks. This implies that more than 90% of all stocks in each index closed lower [AD Percent = (Advances-Declines)/Total Issues].
Up/Down Volume Percent also exceeded -80% for all three indexes on Monday. This implies that 90% of volume in each index was in declining stocks. This is the first triple 80% Up/Down Volume% day since late December. As the chart below shows, the triple 80% Up/Down Volume% day in early December signaled the start of a sharp decline that month.
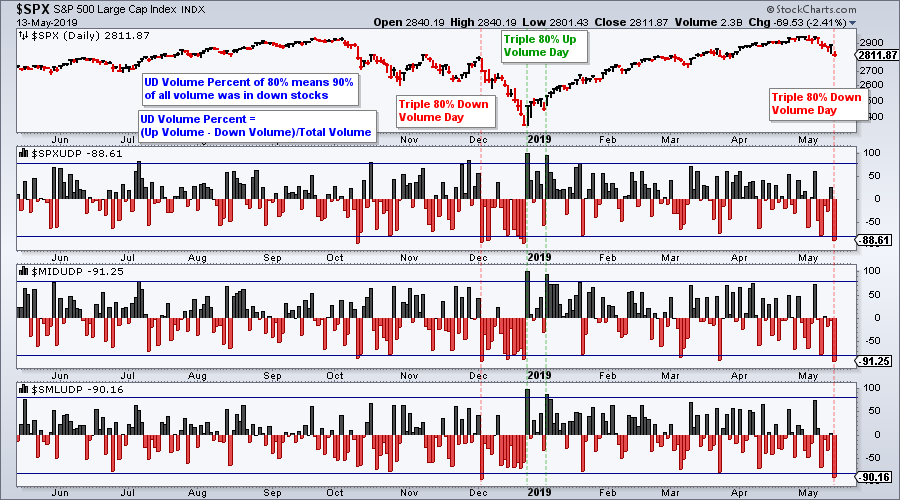
Notice that a triple 80% Up/Down Volume% day marked the late December bottom and there was another triple 80% Up/Down Volume% day in early January. Yesterday's triple 80% Up/Down Volume% day is another shot across the bow, but it occurred after a 2.2% decline in the S&P 500 last week and a 2.4% fall on Monday. Thus, this triple 80% Up/Down Volume% day is coming when the index is already oversold and this could lead to a short-term bounce. It is like a selling climax.
Breadth Table Update (Still Bullish)
Despite strong selling pressure last week and on Monday, the breadth table remains unchanged and still net bullish. The majority of indicators turned bullish on February 15th and six of the nine indicators remain on bullish signals. This implies that 2/3 of the market is bullish and 1/3 is bearish. Hence, there are still some sizable pockets of weakness out there and it is a stock picker's market.
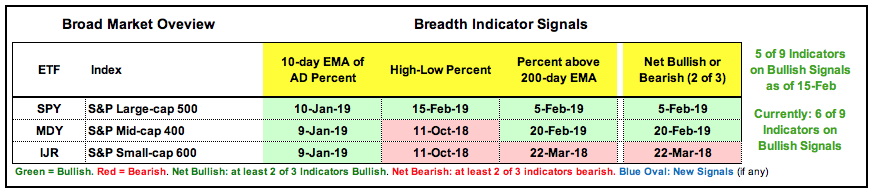
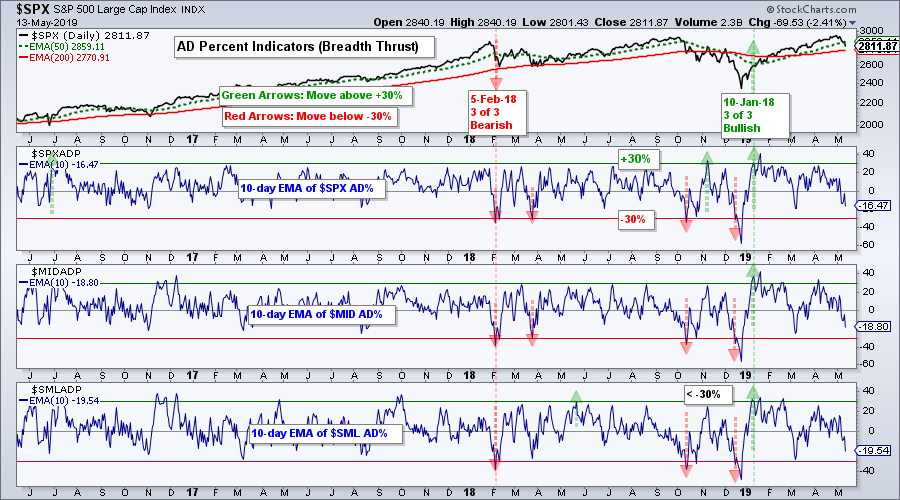
The 10-day EMAs of AD Percent trigger bullish signals with a surge above +30%. These signals remain active until reversed with a bearish signal (move below -30%). Such moves represent a bullish/bearish breadth thrust that can signal the start of an extended move.
The High-Low Percent indicators trigger bullish signals with a move above +10%, which shows enough upside leadership (new highs) to support an uptrend. These signals remain active until reversed with a bearish signal (move below -10%).
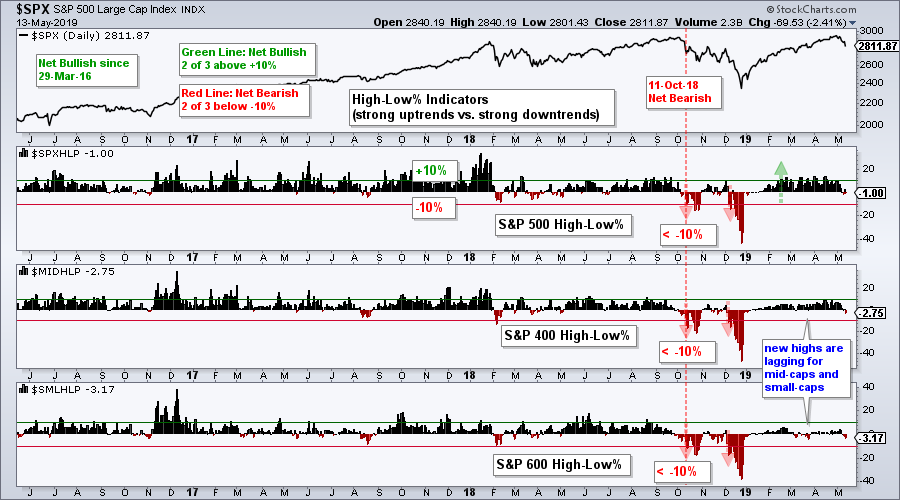
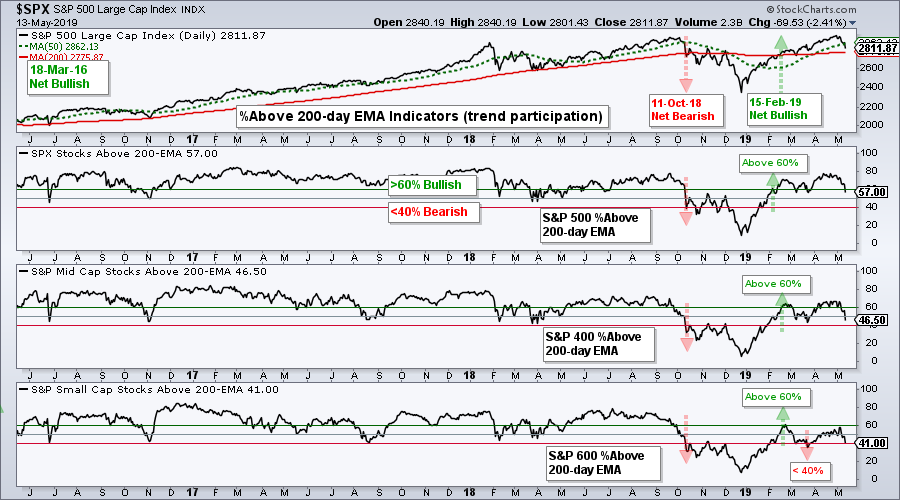
The %Above 200-day EMA indicators trigger bullish signals with a move above 60%. This means well over 50% of stocks in the index are in uptrends and this is enough to support a bull market. These signals remain active until reversed with a bearish signal (move below 40%).
Four Steps up and One Step Back
The S&P 500 surged some 25% from late December to late April and the biggest pullback was just 3.5% in early March (from high to low). The index is now down around 5% from its high and the sky is suddenly falling. Seriously? The index was entitled to a pullback after such an advance and I still consider this a pullback within a bigger uptrend. At this point, the S&P 500 has retraced a quarter (25%) of the prior advance. This is still fairly mild for a pullback.
The current decline may or may not mark a major top. As far as I am concerned, the bulk of the evidence remains bullish for stocks and I will adhere to this assumption until the evidence changes. The breadth table is still net bullish, the S&P 500 is above its 200-day SMA and the 20-day is above the 200-day. The index is near a potential support zone, which is based on broken resistance and the late March lows. The index is also short-term oversold ripe for at least an oversold bounce.
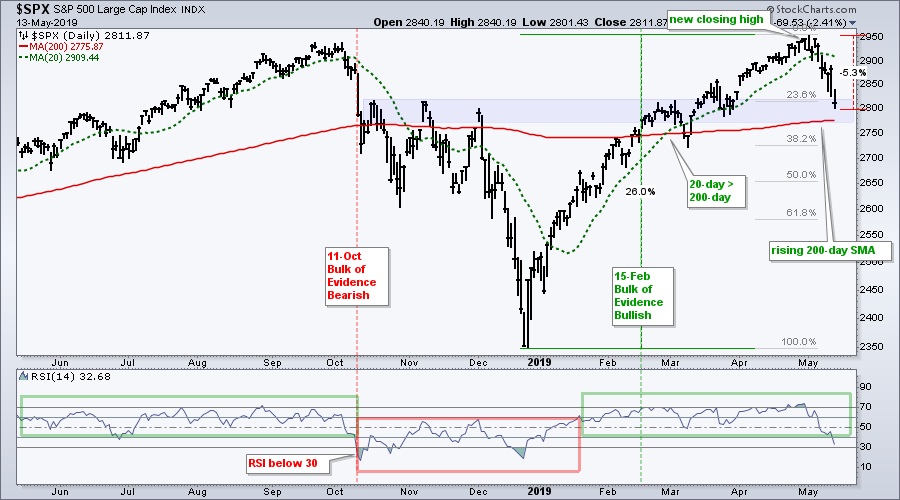
The indicator window shows 14-day RSI moving below 40 for the first time this year. The break below the bull zone (40 to 80) is negative, but it is just one data point and similar to a trend line break in that it signals a change in momentum and not necessarily a trend reversal. Sometimes RSI overshoots and ends up holding above 30. The real trouble could start when/if RSI breaks below 30. Even though such a move would mean RSI is oversold and ripe for a bounce, it would also reflect strong downside momentum that could signal the start of an extended move lower (see October).
SPY Hits Support and Becomes Oversold
The next chart shows SPY becoming oversold again this week and forming an indecisive candlestick near support in the 280 area. In contrast to 14-day RSI, I typically use 5-day RSI for overbought and oversold readings that may foreshadow a mean-reversion move. A move above 70 in an downtrend can foreshadow a peak (November-December), while a move below 30 can foreshadow a trough (March). Last week's dip and move back above 30 did not work as SPY fell on Monday. Not all signals work.
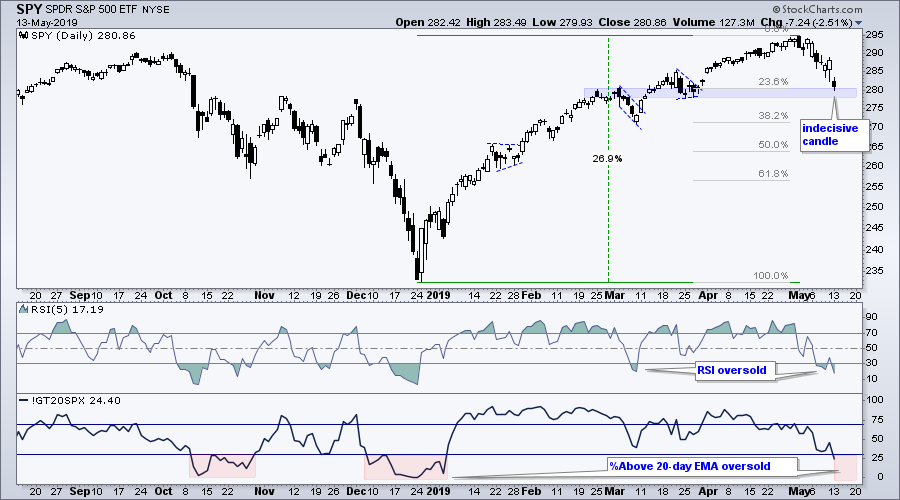
The lower window shows the S&P 500 %Above 20-day EMA (!GT20SPX) moving below 30% for the third time in the last nine months. This puts the indicator in oversold territory and a move back above 30% would provide a bullish mean-reversion signal (oversold bounce). It is important to set your profit target and exit before considering a mean-reversion trade.
Interest in Tariffs and Fed
And finally, I will close with two unorthodox indicators from Google Trends. The first chart shows the S&P 500 and the "interest" in the term "tariff" over the last two years. I suspect that the term "interest" is more negative than positive because negative news generates more sensation that positive news. Notice how interest shot up in the first quarter of 2018 and this coincided with a volatile period for the S&P 500 (red zone). Interest in the term spiked over the last two weeks and this also means we may be in for a volatile period. Also note that the worst four month period begins in June. Thus, we could be in for a choppy ride in the coming months.
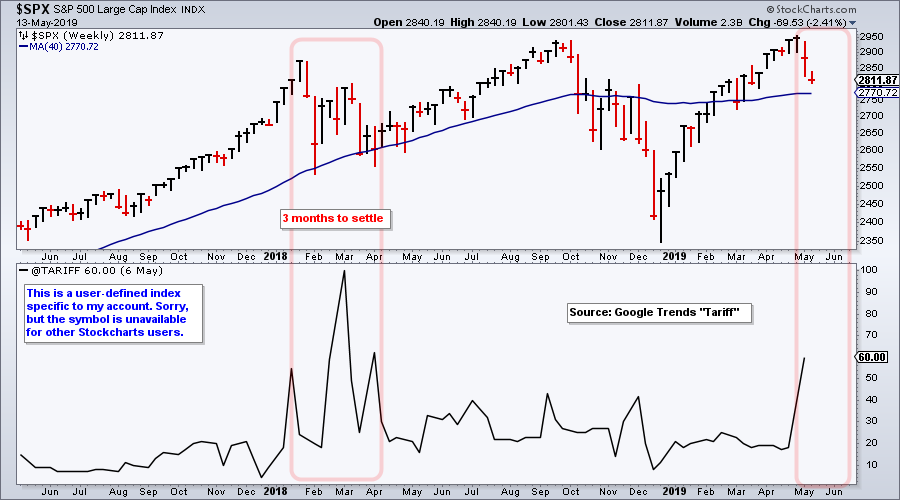
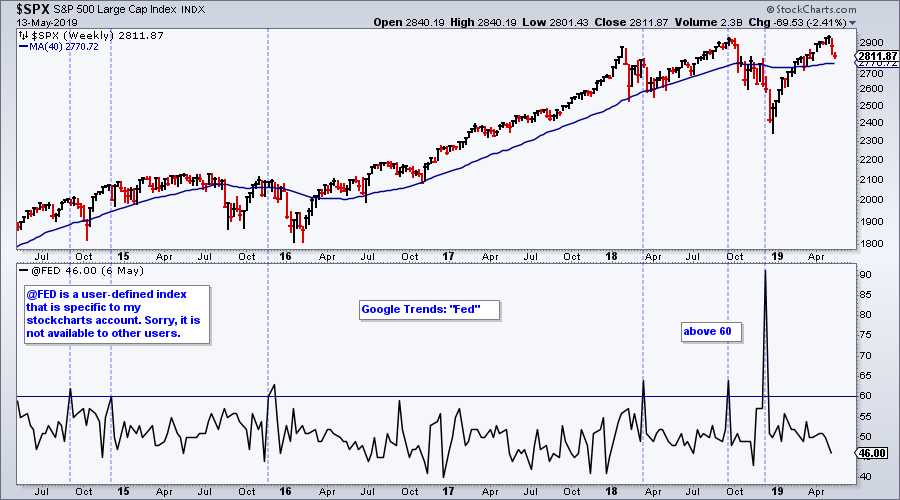
@TARIFF and @FED are user-defined indexes that I created in my StockCharts account. Sorry, these are user specific and the symbols are not available to other users.
You can learn more about user-defined indexes in this customer support article.
The next chart shows the S&P 500 with interest in the term "Fed". Notice how interest in this term spiked in December as the market plunged (blame when to the Fed). The blue lines show when interest in this term exceeded 60, on a scale from zero to 100. In general, the stock market did not perform well in subsequent weeks. This is by no means a scientific study!
Arthur Hill, CMT
Senior Technical Analyst, StockCharts.com
Author, Define the Trend and Trade the Trend
Want to stay up to date with the latest market insights from Arthur?
– Follow @ArthurHill on Twitter
– Subscribe to Art's Charts
– Watch On Trend on StockCharts TV (Tuesdays / Thursdays at 10:30am ET)


