- Long-term Uptrend Still Dominates.
- SPY Holds Wedge Breakout and 50-day.
- Biotech ETFs Firm in Reversal Zones.
- Chinese ETFs Diverge.
- Art's Charts ChartList.
- On Trend on SCCTV and Youtube.
... Long-term Uptrend Still Dominates
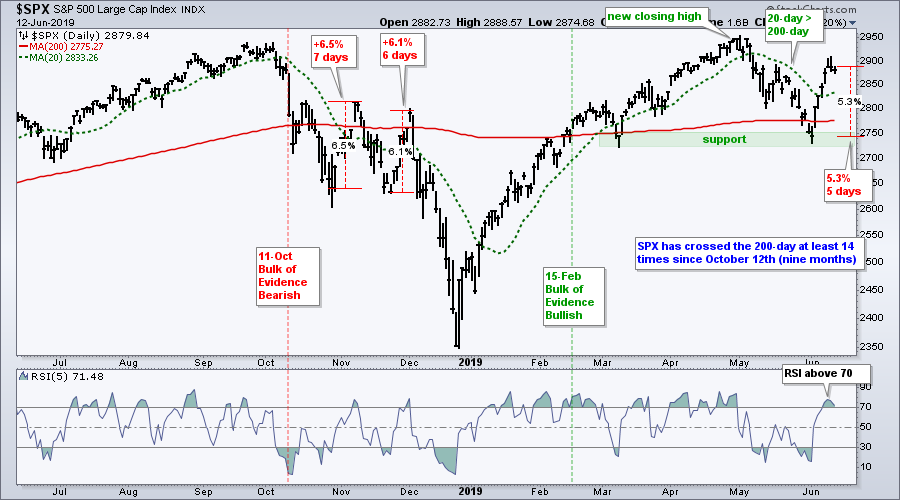
... Let's break down the S&P 500 by starting with the bigger trend. It is important to begin with the bigger trend because this is the dominant force at work and this trend defines my overall bias. Sometimes it is difficult to leave our biases at the door and look at the market for what it is. The S&P 500 is by far the most important market barometer and this index drives my broad market assessment. Small-caps, retail stocks, the Fed, economics and tariffs are all interesting, but the market has a mind of its own and the S&P 500 is the one to watch.
The long-term trend is up for the S&P 500. The index and SPY recorded all time highs in late April and are currently around 2% from these highs. In addition, the 20-day SMA (not shown) is above the 200-day SMA. Yeah, it’s a broken record, but it is what it is.
SPY Holds Wedge Breakout and 50-day
The short-term trend is up for SPY. The ETF fell around 7% from early May to early June and formed a falling wedge. This decline reversed with a four candlestick reversal that included a gap down and gap up. The wedge breakout held and SPY is just above its 50-day SMA.
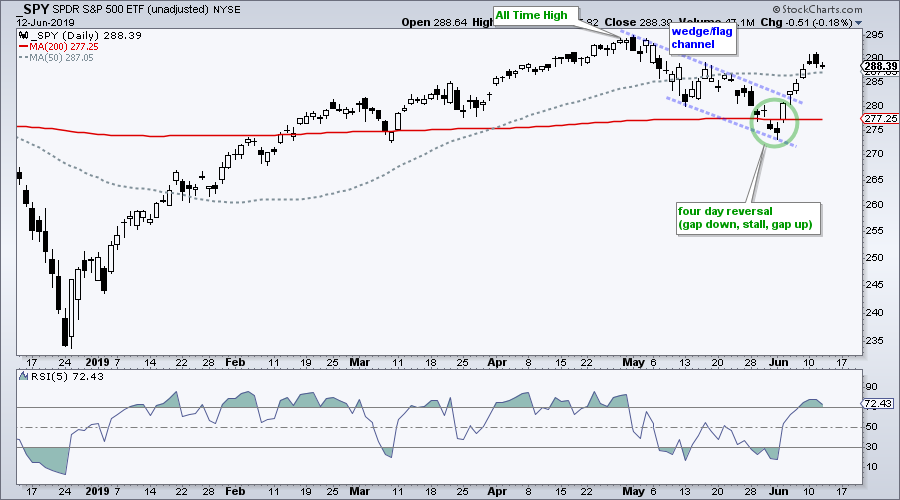
Short-term, the market is in between a rock and a hard place because the trend is up and SPY became short-term overbought after a 5% surge in five days. RSI(5) also moved above 70. Overbought, however, is not necessarily bearish because stocks can become overbought and remain overbought, especially within a long-term uptrend. This could be the case as long as SPY hold its 50-day SMA. A close below 285 would provide the first sign of a short-term downturn.
What's the last thing you expect the market to do? Better get ready for it!
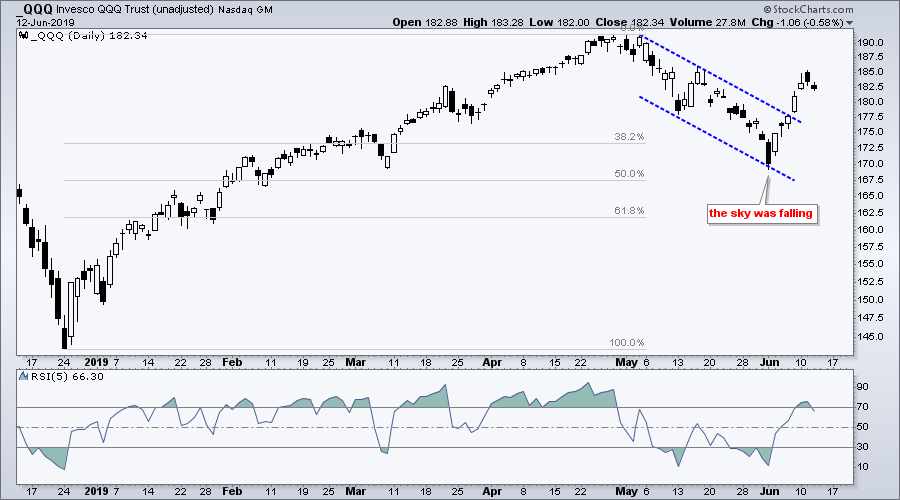
The next chart shows QQQ breaking out of a falling channel.
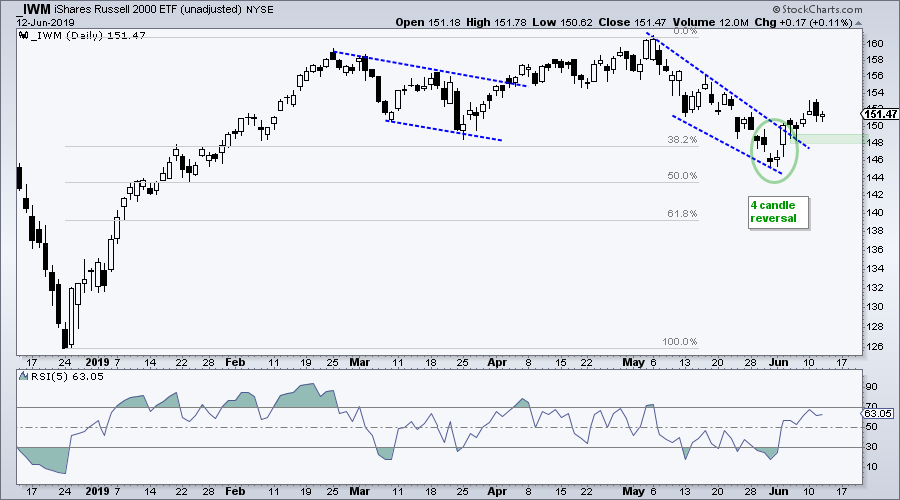
The next chart shows IWM with a four candle reversal and wedge breakout. The lows on 5-6 June mark support at 148 and a break here would negate the wedge breakout.
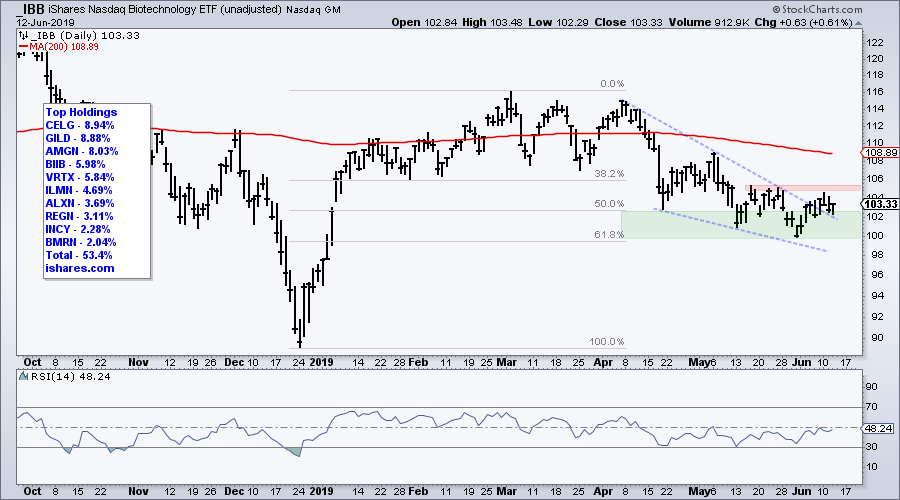
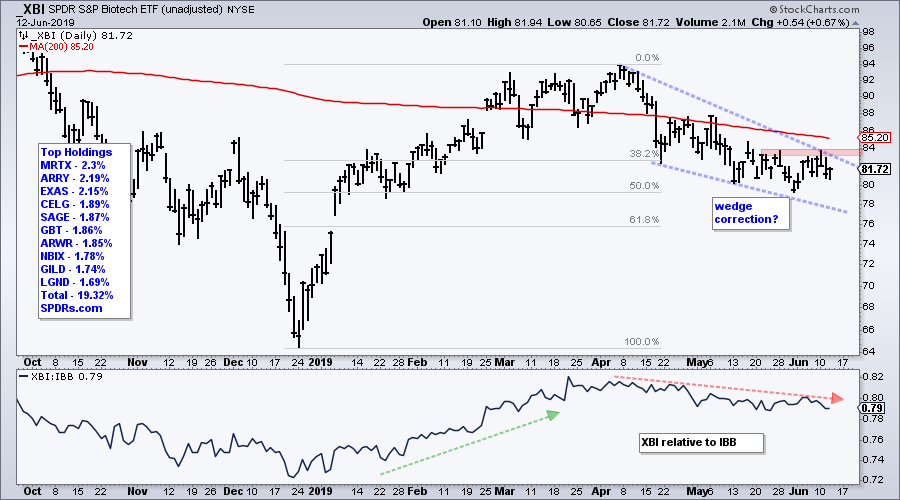
Biotech ETFs Firm in Reversal Zones
Biotechs have been lagging over the last two months, but XBI and IBB are in potential reversal zones that merit out attention. The setup here is a classic: both retraced 50-61.8% of the prior advance and formed falling wedges in the process. Both the wedge and the retracement amount are typical for corrections after a sizable advance. A break above the late May highs would signal an end to this correction and a resumption of the prior advance, which was from late December to early March.
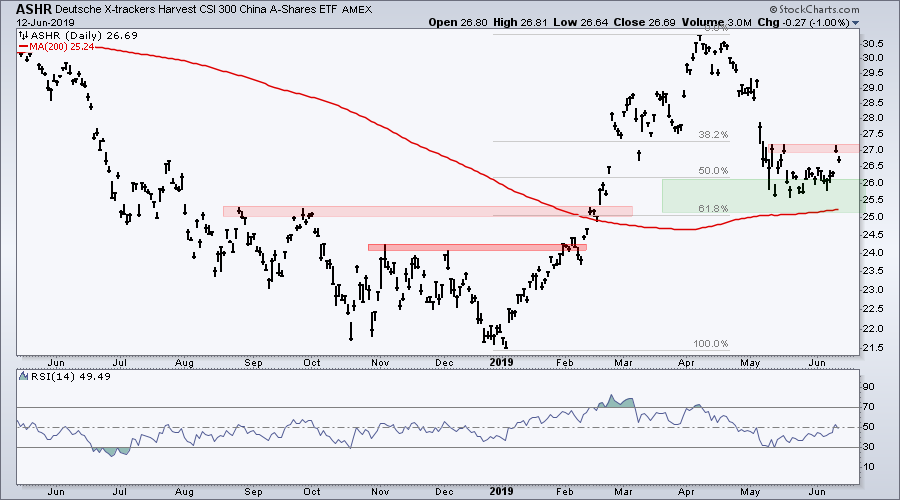
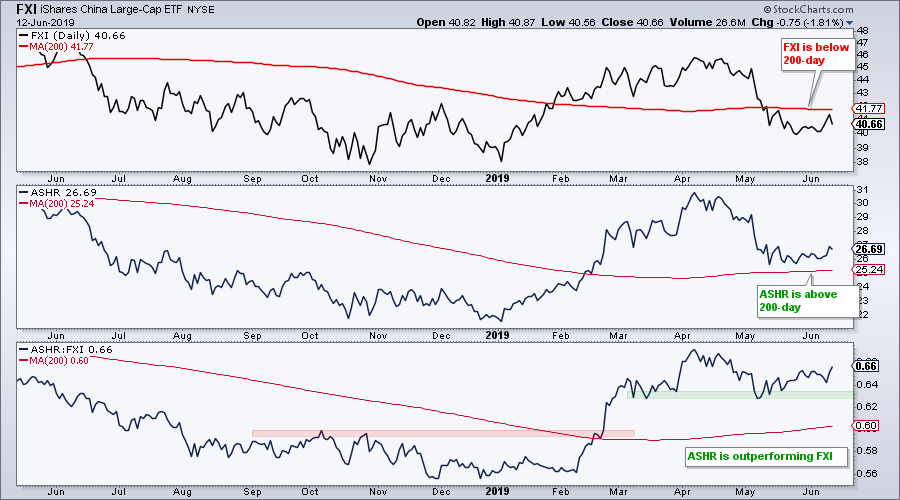
Chinese ETFs Diverge
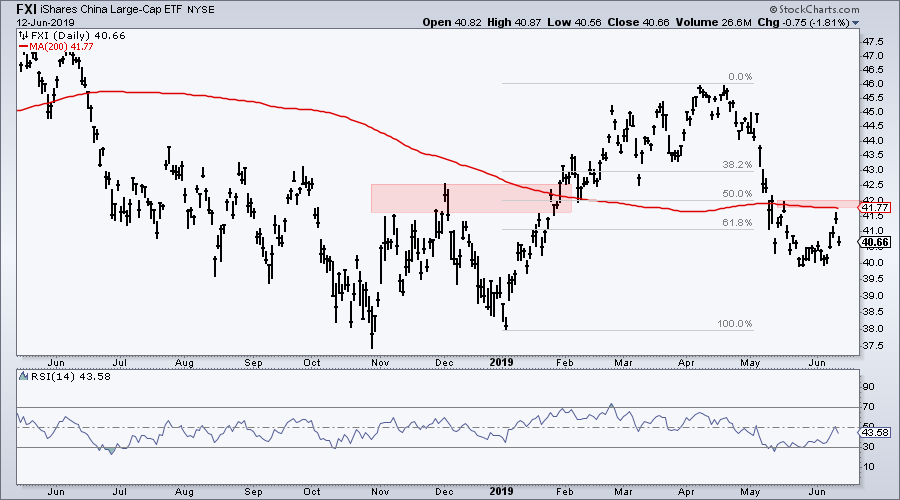
The CSI 300 China A-Shares ETF (ASHR) is showing signs of life as it bounces off a key retracement zone. The China iShares (FXI) also bounced, but it is underperforming its counterpart. Note that ASHR is a broad-based ETF with over 300 stocks. It is an equal-weight ETF that reflects the performance for small-caps and mid-caps. FXI, on the other hand, has around 62 stocks and is weighted towards large-caps. The top ten stocks account for 55% of the ETF's weighting.
The first chart shows ASHR firming where it should and bouncing this week. The ETF retraced 50-61.8% of the prior advance and found support near broken resistance. This first bounce failed near 27 and a move above the mid May highs is needed for a robust breakout.
The second chart shows FXI falling below the 61.8% retracement, broken support and the 200-day SMA. The ETF remains above its October-January lows though. As with ASHR, FXI bounced and then fell back. A breakout at 42 is needed to reverse the May-June decline.
The next chart compares the two ETFs and shows the price relative (ASHR:FXI ratio) in the lower window. ASHR is clearly the stronger of the two right now. FXI broke below its 200-day and ASHR held its 200-day. The ratio broke out in late February as ASHR outperformed from February to early April. The ratio then held its March-May lows as ASHR held up better than FXI.
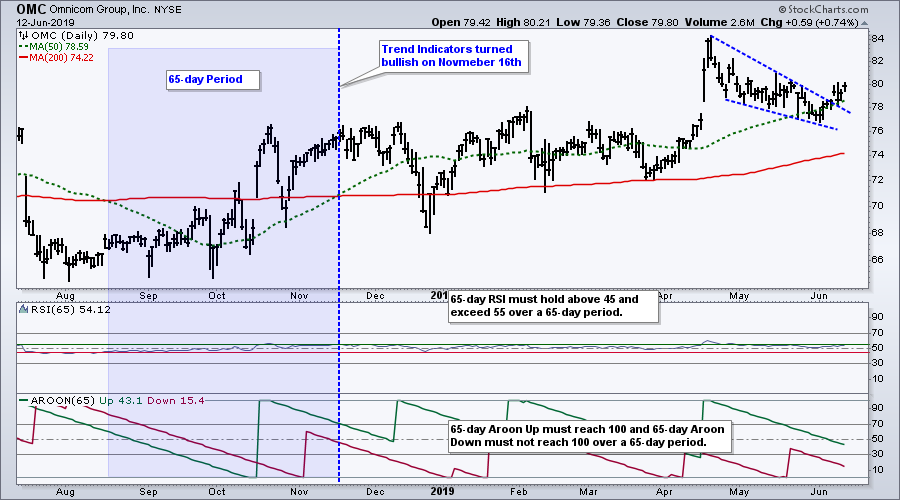
Art's Charts ChartList
The Art's Charts ChartList has been updated with 30 stocks that are "On Trend". These were picked from a scan based on 65-day RSI and 65-day Aroon Up/Down. I will be posting a System Trader article with details next week. A stock makes the scan when 65-day RSI does not dip below 45 and exceeds 55 during a 65 day period. In addition, 65-day Aroon Up must reach 100 and 65-day Aroon Down must NOT reach 100 over a 65-day period. Note that 65-day Aroon Up reaches 100 when a stock records a 65-day high and 65-day Aroon Down reaches 100 when a stock records a 65-day low. Thus, a stock must record a 65-day high and must NOT record a 65-day low (over 65 days) to make the scan. The chart below shows Omnicom with these indicators.
On Trend on YouTube (Thursday, June 13th)
- SPY, QQQ and IWM Hold Breakouts
- Biotech ETFs Hit Reversal Zones
- Chinese ETFs Diverge as ASHR Outperforms
- "On Trend" Stocks to Watch
- Click here to Watch
Arthur Hill, CMT
Senior Technical Analyst, StockCharts.com
Author, Define the Trend and Trade the Trend
Want to stay up to date with the latest market insights from Arthur?
– Follow @ArthurHill on Twitter
– Subscribe to Art's Charts
– Watch On Trend on StockCharts TV (Tuesdays / Thursdays at 10:30am ET)


