- Strategy Recap.
- RSI Signal Examples.
- Aroon Signal Examples.
- Testing the Individual Signals.
- Selecting from Scan Results.
 ... Last week I showed a scan using RSI(65) and Aroon(65) to find stocks showing steady and consistent uptrends. Today I will backtest this scan on stocks in the S&P 500 over the last twenty years and show how we can use this scan to find bullish setups. Details on this scan and strategy can be found in this System Trader article.
To recap, the strategy uses 65-day RSI and 65-day Aroon. First, RSI must exceed 55 and hold above 45 for at least 65 days. Second, 65-day Aroon Up must reach 100 and 65-day Aroon Down must NOT hit 100. Note that 65-day Aroon Up/Down hits 100 when a stock records a 65-day high/low. I am using 65 days because this represents around three months. I want to see these indicators triggering for at least three months.
Today I will be running a "signal" test on every stock in the S&P 500 over the last twenty years (historical constituents). This means a stock is tested only when it is a member of the S&P 500. Facebook, for example, is included in the testing from December 2013 onwards, but not before December 2013 because it was not a member of the index then. The strategy is only active when the 20-day SMA of the S&P 500 is above the 200-day SMA (bull market environment).
This is an all signals test that trades $1000 per stock. I am not interested in the compound annual return or maximum drawdown because this is a nominal and equal amount. Instead, I just want to know if there is a positive expectation or edge based on 1000s of trades. For metrics, I am interested in the winning percent, the average gain/loss and the profit factor, which is the total profits from the winners divided by the total losses from the losers. A profit factor above 2 is preferable because this implies a better than 2:1 reward to risk ratio.
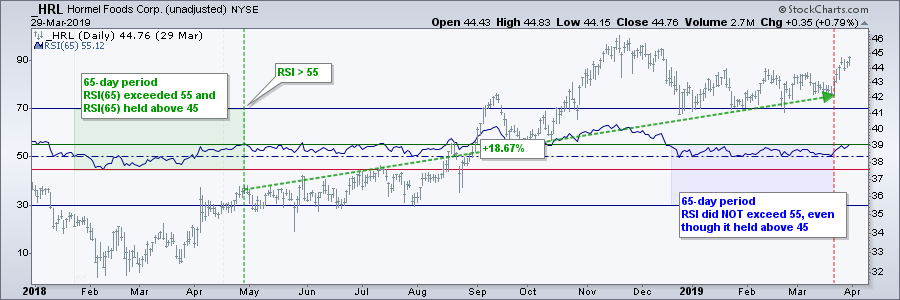
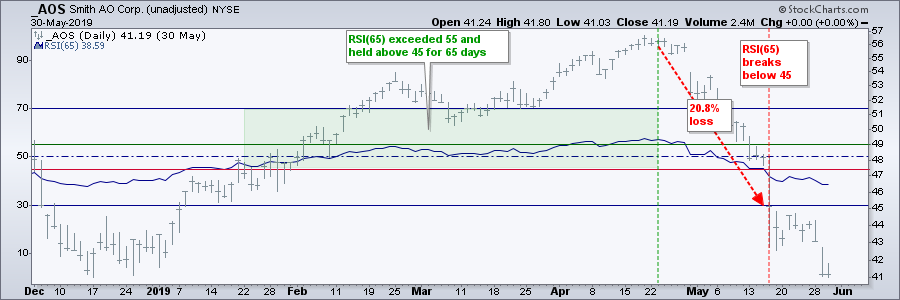
RSI Signal Examples
The Hormel (HRL) chart shows a winning example when buying and selling solely based on the RSI(65) signals. The Smith AO (AOS) chart shows a losing signal. A buy signal triggers when RSI(65) exceeds 55 and holds above 45 over a 65-day period. The move above 55 shows strong upside momentum, while ability to hold above 45 reflects limited pullbacks. The sell signal triggers when RSI(65) fails to exceed 55 over a 65-day period or breaks below 45. Either upside momentum stopped and/or the declines deepened.
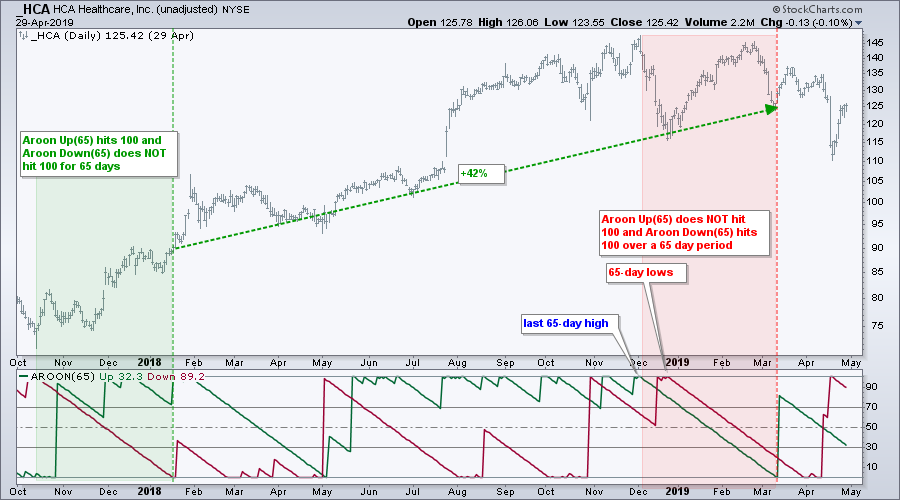
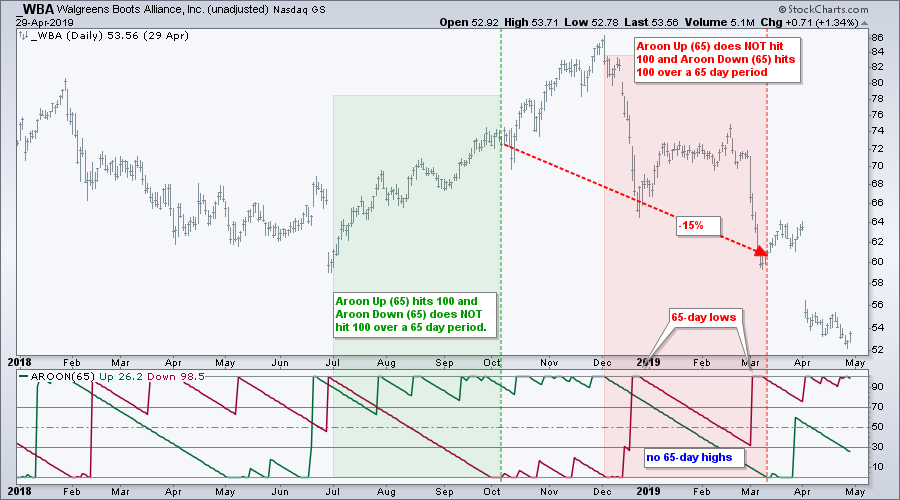
Aroon Signal Examples
The HCA Healthcare (HCA) chart shows a winning example when buying and selling solely based on the Aroon (65) signals, while the Walgreens-Boots (WBA) chart shows a losing signal. The buy signal triggers when Aroon Up (65) hits 100 and Aroon Down (65) does not hit 100 over a 65 day period. This means the stock was hitting 65-day highs on a regular basis and not hitting 65-day lows (uptrend). The sell signal triggers when Aroon Up (65) does NOT hit 100 and Aroon Down (65) hits 100 over a 65-day period. This means the higher highs stopped and the lower lows began.
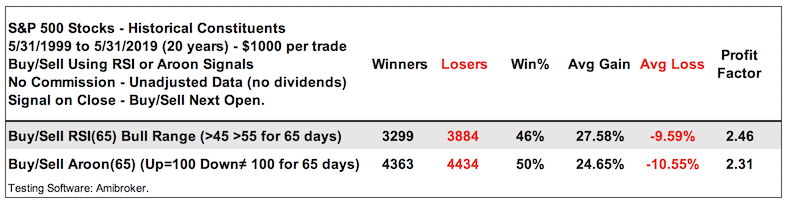
Testing the Individual Signals
These are basically trend following strategies that make money by catching trends. We can see that half the trades are winners and half are losers as the winning percent ranges from 46 to 50 percent. The average gain is more than twice the average loss and the profit factors are well above 2.
The next table shows when we combine the RSI signals with the Aroon signals. The strategy buys when both RSI and Aroon are on active bullish signals and sells when both are no longer on active bullish signals. While everyone has their favorite performance metric, I prefer the profit factor when performing an all signal test. Notice that the winning percentage was 49%, the average gain was almost three times the average loss and the profit factor was 2.66, which is higher than in the individual test. Thus, there is some merit to combining the signals.
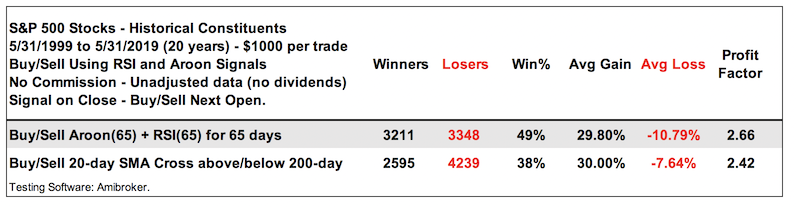
The last line on the table below shows a system that buys when the 20-day SMA crosses above the 200-day SMA and sells when the 20-day SMA crosses below the 200-day. Think of this as a benchmark trend-following test. The Winning Percentage fell to 38%, but the Average Gain was almost four times the average loss. The low winning percentage weighed on the profit factor as it fell to 2.42.
Note that dividends were not included in the results. I suspect that the avaerge gain would be around 2% high with dividends added and the profit factor would be close to three. I tested without dividends because they are the icing on the cake. The system itself is the cake!
Selecting from Scan Results
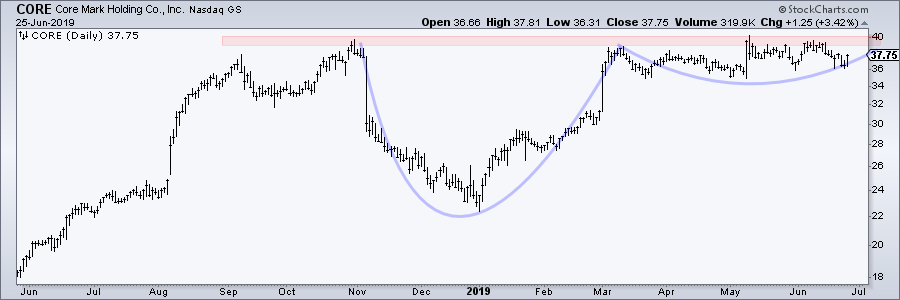
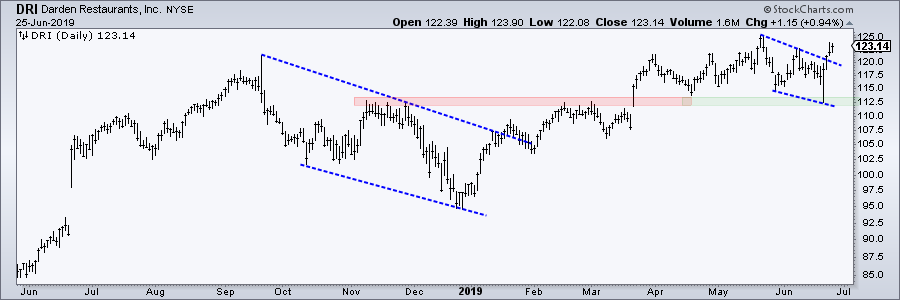
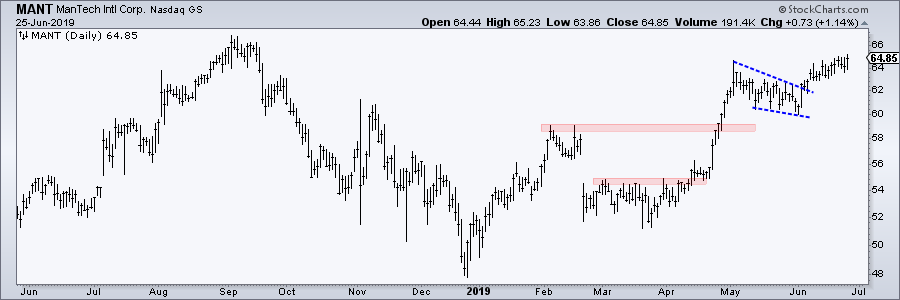
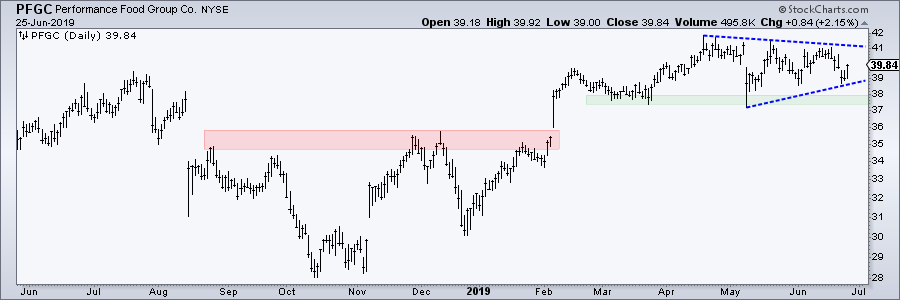
The evidence shows a positive expectancy using the RSI-Aroon strategy. A recent run of the scan code shown last week produced around 700 results (stocks that met the criteria). Chartists can tighten the criteria or pour a fresh cup of java and scroll through the CandleGlance charts. Click here to learn more about working with scan results and here to learn more about CandleGlance charts.
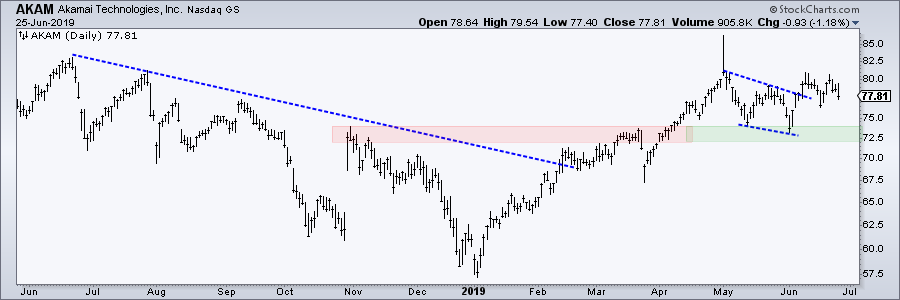
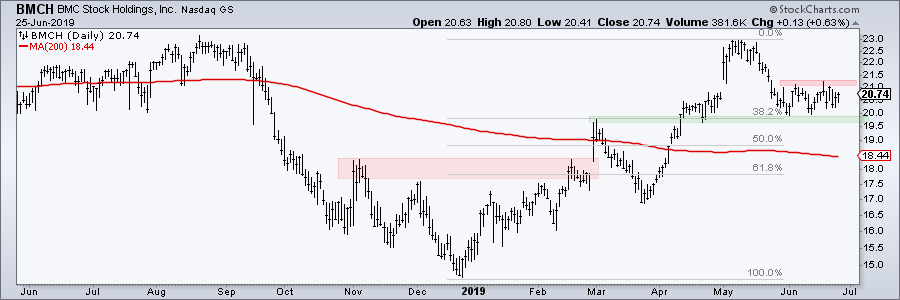
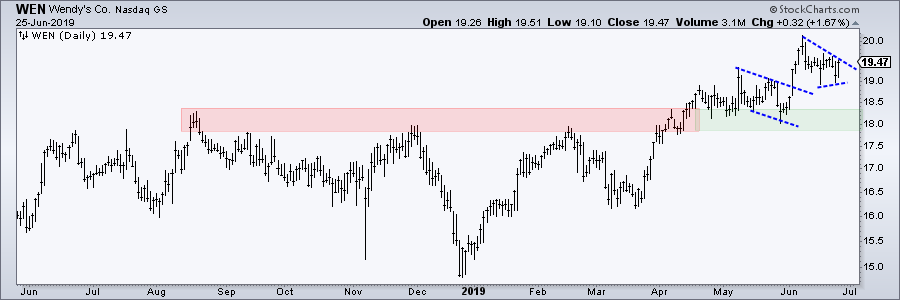
I am basically looking for short-term bullish setups and it only takes a few seconds per chart. This can be done in under two hours and I only need to do it once per week. After the initial cull, I have a ChartList with a few dozen charts to follow in the coming days. Here are a few examples.
Arthur Hill, CMT
Senior Technical Analyst, StockCharts.com
Author, Define the Trend and Trade the Trend
Want to stay up to date with the latest market insights from Arthur?
– Follow @ArthurHill on Twitter
– Subscribe to Art's Charts
– Watch On Trend on StockCharts TV (Tuesdays / Thursdays at 10:30am ET)


