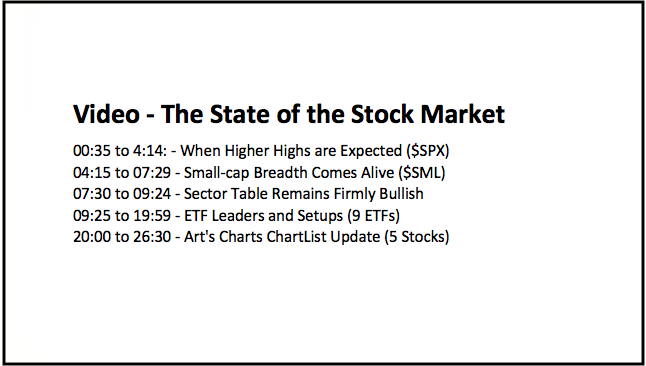
- When Higher Highs are Expected.
- Small-cap Breadth Comes Alive.
- Sector Table Remains Firmly Bullish.
- ETF Leaders and Setups.
- Art's Charts ChartList Update.
... When Higher Highs are Expected
... Let's review the weekly chart for the S&P 500 first. The index surged some 26% from late December to late April and recorded a new all time high. After a garden-variety 7% decline in May, the index rebounded in June and recorded another new all time high. The index is above its 40-week SMA and RSI moved into its bull zone in early April. Overall, this chart is bullish with the 40-week SMA and early June low marking support in the 2700-2770 area. A close below 2700 would forge a lower low and reverse the current uptrend.
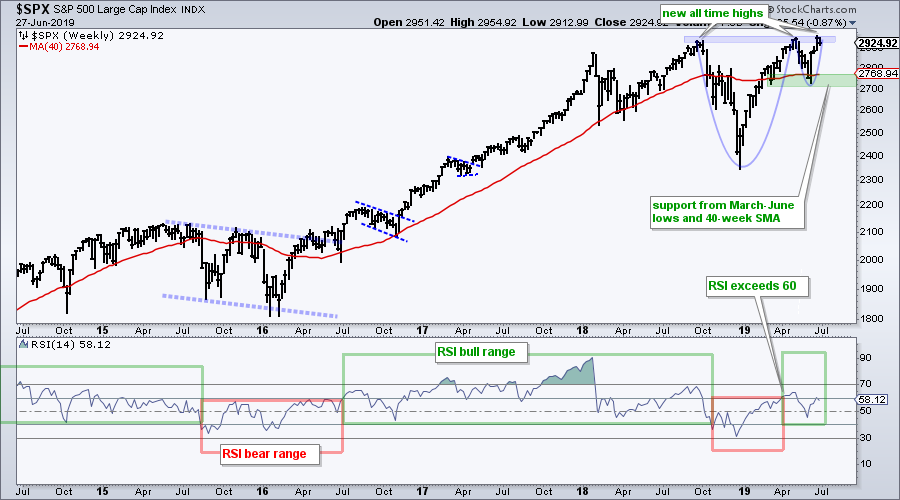
The blue lines show a possible cup-with-handle pattern, and it is a biggie. This is a bullish continuation pattern popularized by William O'Neil of IBD. Technically a break above rim resistance would be bullish and target a move to 3500. The height of the cup is added to the rim breakout for a target. I am not a big fan of these price targets and I do not think the pattern adds much value to the chart because the evidence is already bullish. Thus, a move to new highs is expected until the evidence suggests otherwise.
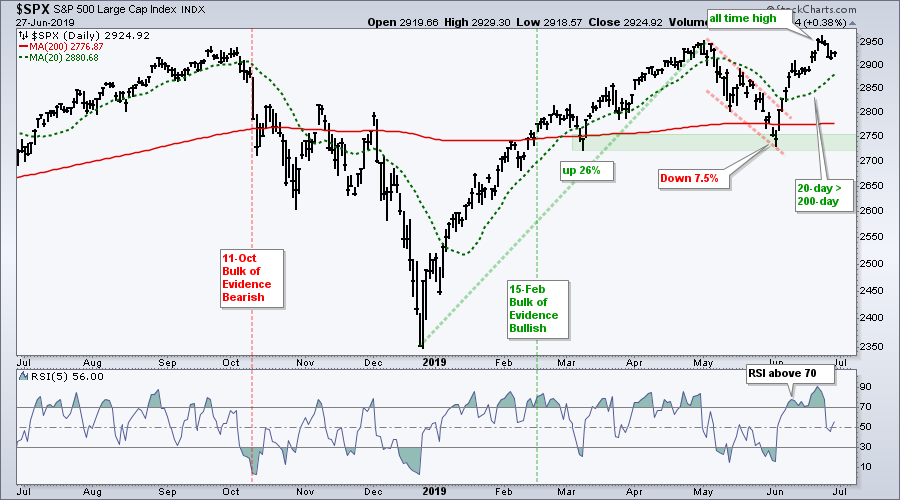
The next chart shows daily prices for the S&P 500 and simply confirms the overall uptrend. The red lines mark a falling wedge and the index broke out with a surge in early June. The 20-day SMA is above the 200-day SMA, and price is well above the 200-day.
By the way, I do NOT consider the 2950 area as a major resistance level. In fact, I do not consider it resistance at all because the bigger trend is up and the shorter trend is up. A move above 2950 is expected when the trend is up. Up, after all, is the path of least resistance.
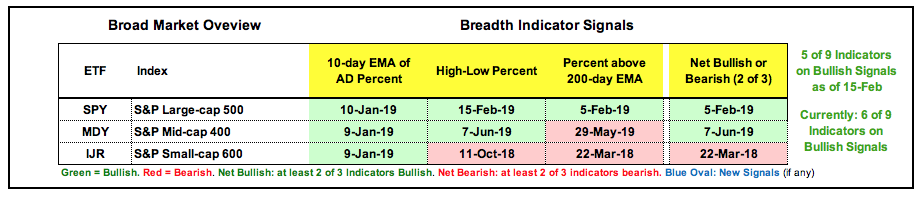
Index Breadth Table Remains Bullish
There is no change in the index breadth table. The majority of indicators have been on bullish signals since February 15th. The Mid-Cap %Above 200-day EMA (!GT200MID), Small-Cap %Above 200-day EMA (!GT200SML) and S&P 600 High-Low% ($SMLHLP) are the three indicators still on bearish signals. Nevertheless, small-caps came alive on Thursday and this could be an interesting development.
Small-cap Breadth Comes Alive
The chart below shows AD Percent for the S&P 500, S&P Mid-Cap 400 and S&P Small-Cap 600 with horizontal lines at +80% and -80%. Keep in mind that a +80% reading means 90% of stocks in the index advanced. $SMLADP surged above +80% for the second time this month and outpaced $MIDADP (+73%) and $SPXADP (+54%) on Thursday. Also note that $SMLADP is the only one of the three to exceed +80% twice this month.
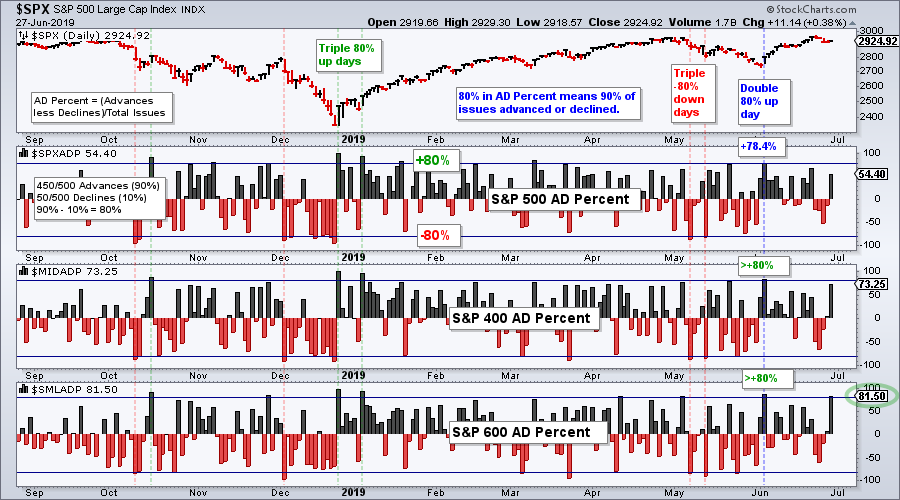
The red lines show triple -80% down days when all three exceeded -80%. This shows broad downside participation that can ignite an extended decline. The green lines show triple +80% up days and the blue line shows a double 80% up day on June 4th. The double +80% day ignited the June advance and it would take at least a double -80% day to reverse this short-term signal.
Sector Table Remains Firmly Bullish
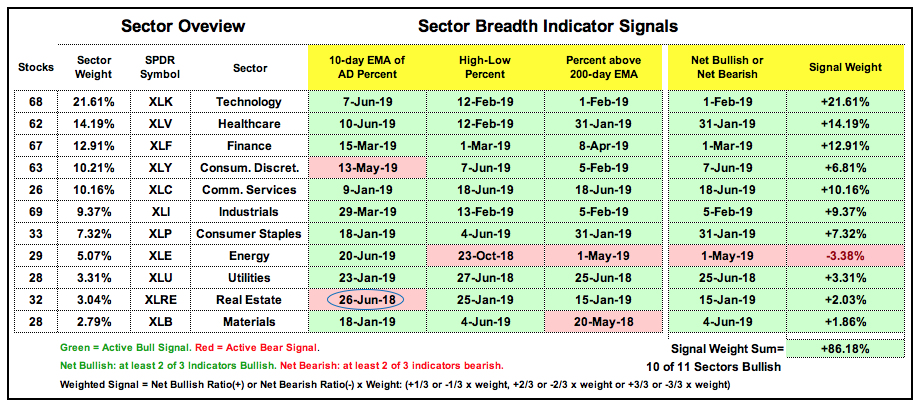
The sector breadth table remains firmly bullish with only one new signal. The 10-day EMA of XLRE AD Percent ($XLREADP) plunged below -30% for a bearish breadth thrust. The other two breadth indicators for XLRE remain on bullish signals so this means the sector is still net bullish. Overall, XLE is the only sector that is net bearish and ten of the eleven sectors are net bullish. Note that XLRE and XLP have been net bullish since January 2019 and XLU has been net bullish since June 2018. These are the longest active bullish signals on the table.
With the bulk of the evidence bullish for the stock market, I am looking for bullish setups on the price charts and/or focusing on the leaders (stocks/ETFs). The idea is to run with the bulls and be long during bull market environments. I am not interested in bearish setups at this time and I certainly do not want to try to pick major market top when the S&P 500 is within spitting distance of an all time high and the weight of the evidence is clearly in favor of the bulls.
Yes, the stock market environment simply remains bullish until proven otherwise. We do not know how long the bull will reign or how far the indexes will extend. We do not know when it will change. We simply know what the current state of the market and invest/trade accordingly.
ETF Leaders and Setups
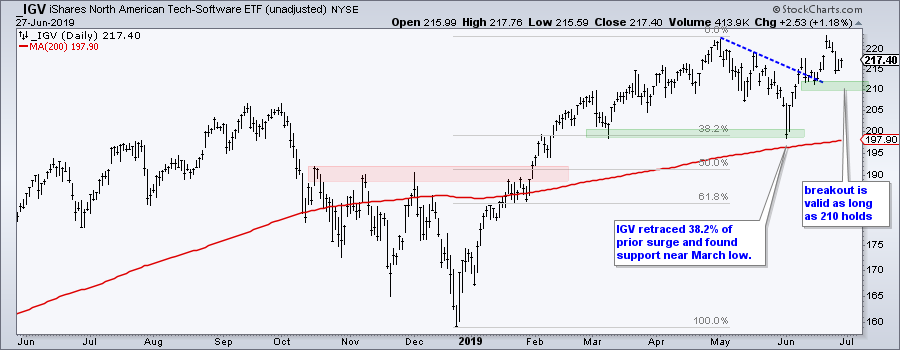
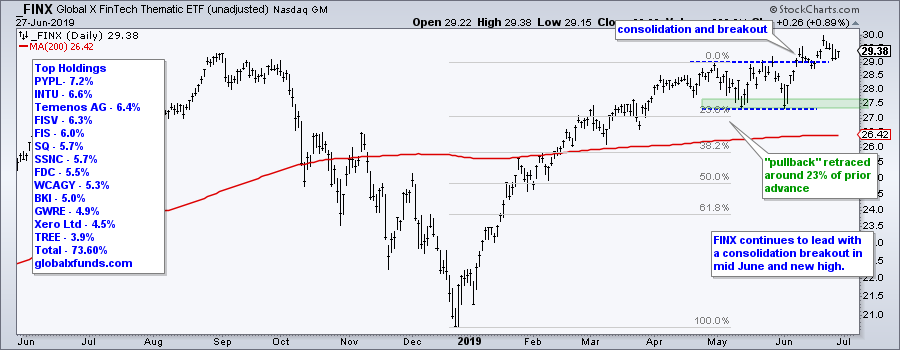
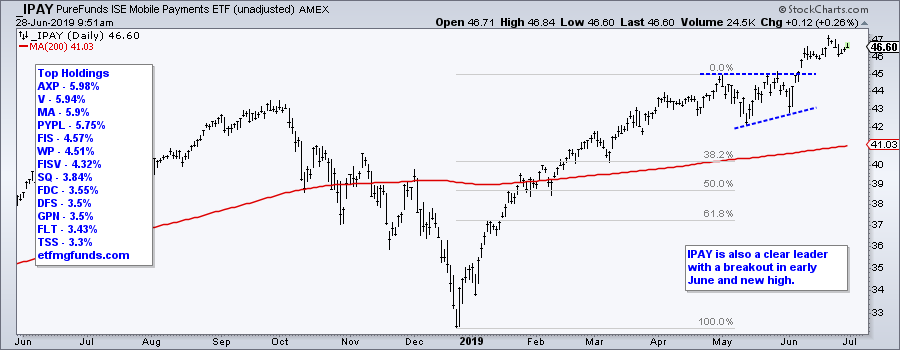
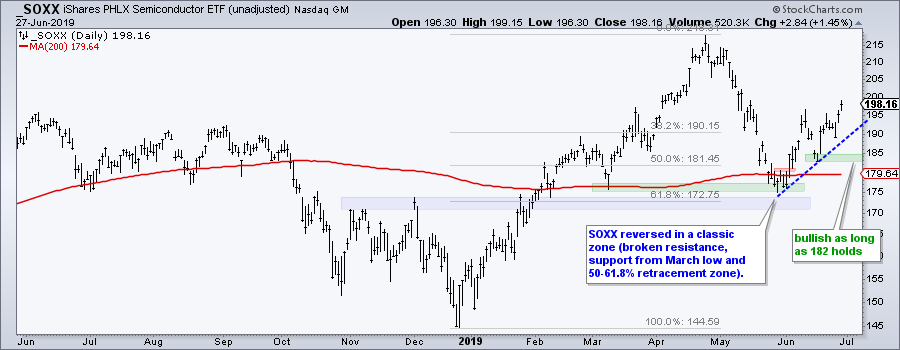
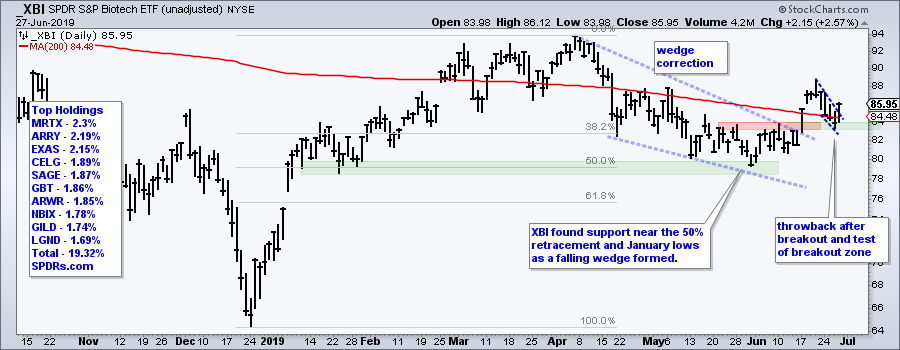
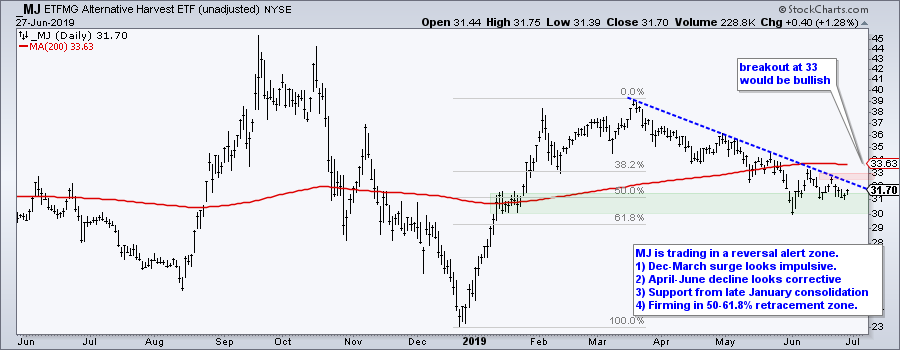
Here are some ETFs showing bullish charts and upside leadership. Well, the Biotech SPDR (XBI) is not really a leader because it is still below its April high, but it does have a breakout working. MJ is also not a leader, but it is trading in a reversal alert zone. Chartists interested in individual stocks should pay attention to the holdings in the Fintech ETF (FINX) and Mobile Payments ETF (IPAY).
Art's Charts ChartList Update
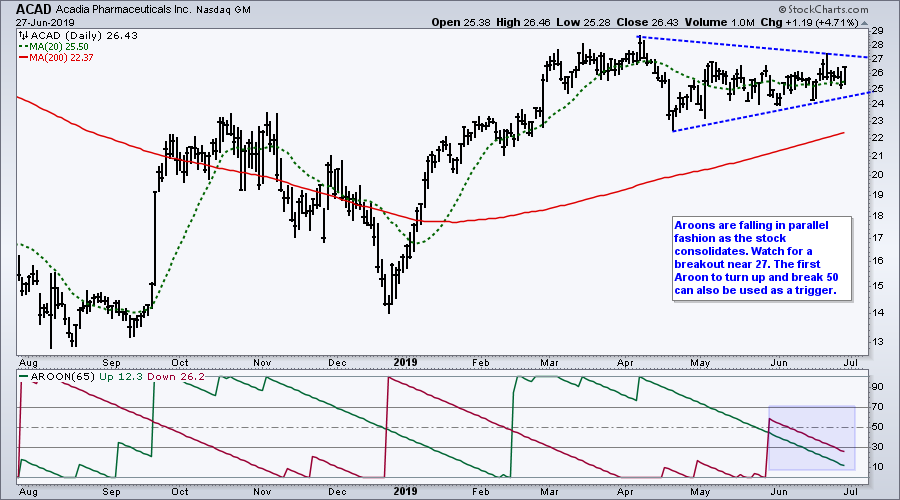
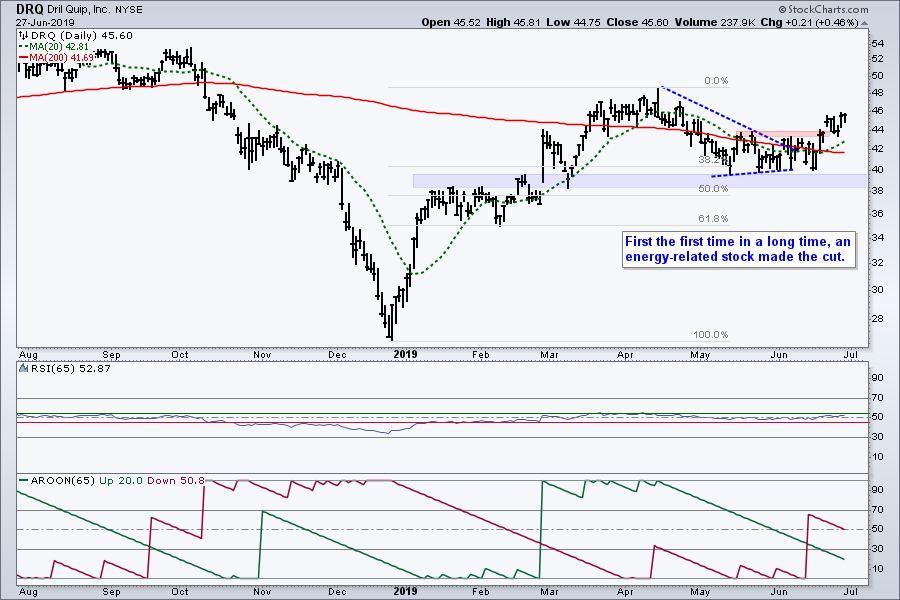
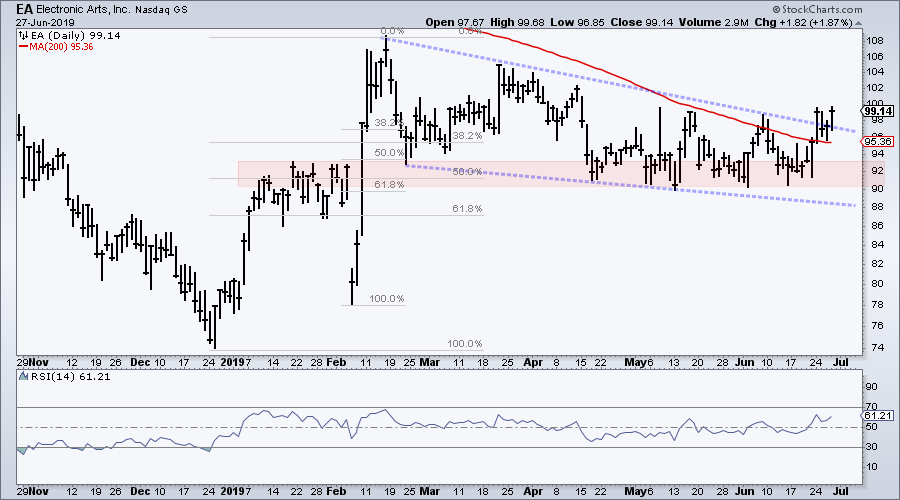
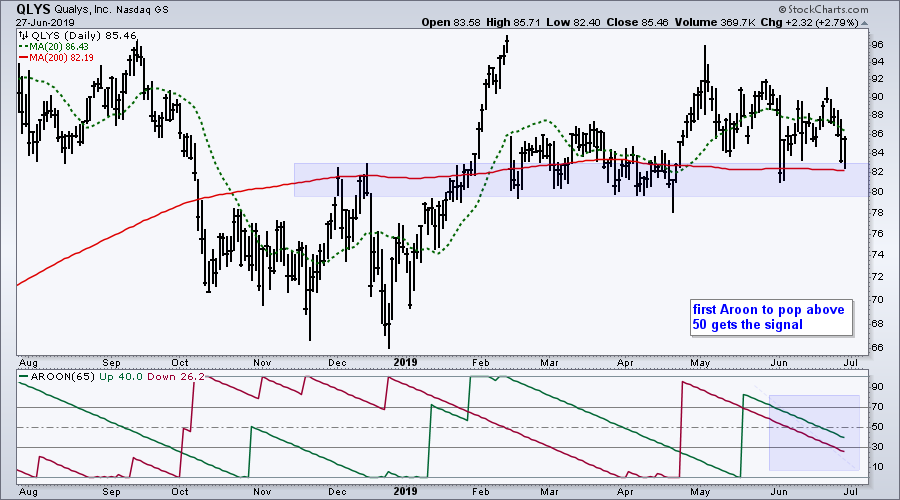
The Art's Charts ChartList has been updated with 30 curated stock charts. These charts were selected based on observations this week and the RSI-Aroon chart scan in this System Trader article. Some charts remain from week to week and some change. The idea is to provide a curated list of stocks for the week(s) ahead.
Click here for the Art's Charts ChartList
Questions, Comments or Feedback?
I do not take symbol request and I cannot promise to response to all correspondence, but I will read it and take into under consideration. I greatly appreciate all feedback because it helps me improve the commentary and provides ideas for the future.

Plan your trade and trade your plan.
Arthur Hill, CMT
Senior Technical Analyst, StockCharts.com
Author, Define the Trend and Trade the Trend
Want to stay up to date with Arthur's latest market insights?
– Follow @ArthurHill on Twitter
– Subscribe to Art's Charts
– Watch On Trend on StockCharts TV (Tuesdays / Thursdays at 10:30am ET)


