Today I am going to dive into breadth by looking at two indicator groups used for short-term market timing and three indicator groups for long-term market timing. Most of you are familiar with these indicators: AD Percent, Up/Down Volume%, High-Low Percent and %Above 200-day EMA. Stocks fell on Wednesday and Thursday, but I have yet to get a short-term bearish signal that would suggest an extended correction. Long-term, the breadth index table has been bullish since mid February and remains bullish.
History does not repeat itself, but it sure does rhyme. Thus, studying the signals over the last five years can provide clues on how the signals might perform going forward. There were whipsaws, good signals and bad signals. Overall, the long-term model was fairly good at avoiding tricky periods (August 2015 to February 2016) and catching big trends (March 2016 to October 2018). This kind of market timing model is designed to participate in bull markets, sit out tricky periods and be out of bear markets.
Downside Participation Contained
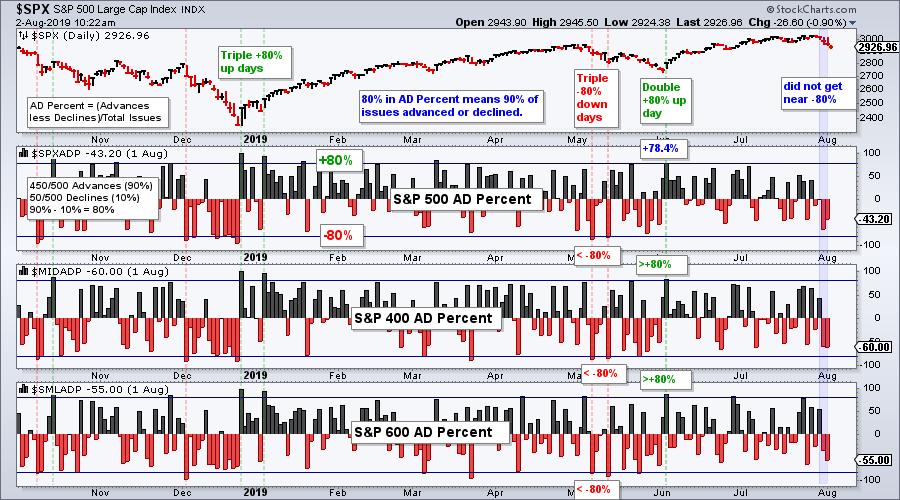
The major index ETFs fell on Wednesday and Thursday, but downside participation and selling pressure were not extreme. The first chart shows AD Percent for the S&P 500, S&P Mid-Cap 400 and S&P Small-Cap 600 [AD Percent = (Advances - Declines)/Total Issues]. This is a pure breadth indicator that measures the degree of participation in a move. The extreme levels are set at +80% and -80%.
As you can see on the chart below, the May decline started with a triple -80% down day and the June advance started with a double +80% up day. These 80% days represent a breadth thrust that can signal the start of a move. Keep in mind, however, that a one day breadth thrust is a short-term signal. A double or triple -80% down day at this stage would signal the start of a correction that could last a few weeks.
Selling Pressure Contained
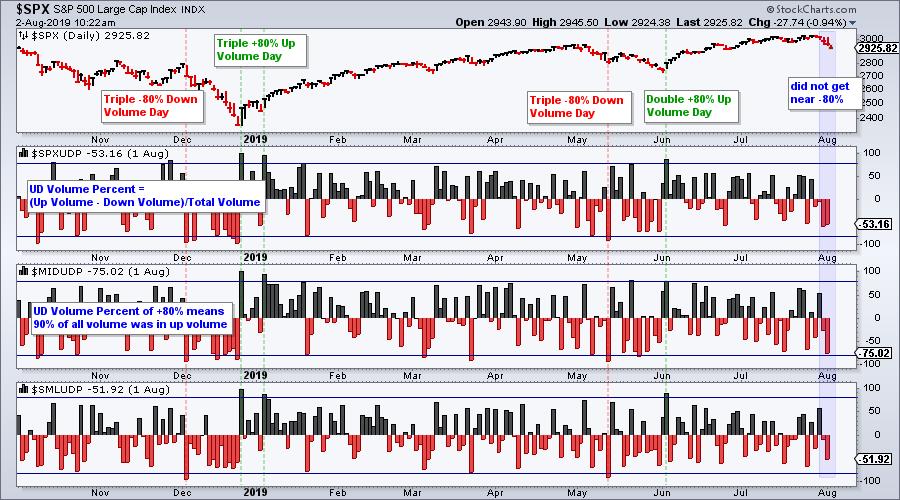
Up/Down Volume% measures buying and selling pressure by throwing volume into the mix. Note that larger stocks tend to trade more volume than smaller stocks so this indicator will have a large-cap tilt. There was a triple +80% down day in mid May, which occurred in the middle of the May correction. There was then a double +80% up day in early June to start the June-July advance. Up/Down Volume% exceeded -50% for all three indexes on Thursday, but remained short of a bearish breadth thrust that would signal the start of an extended correction.
January Breadth Thrust Remains Active
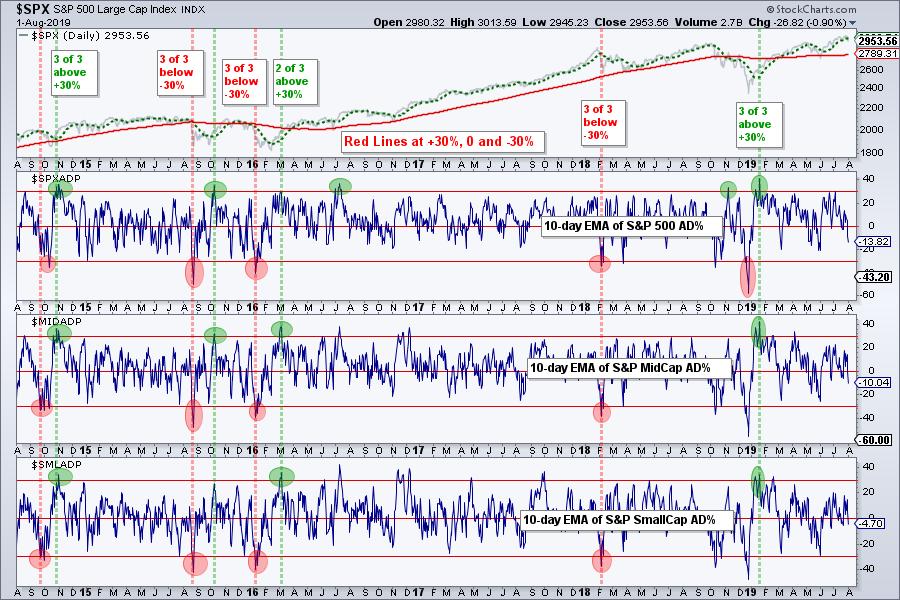
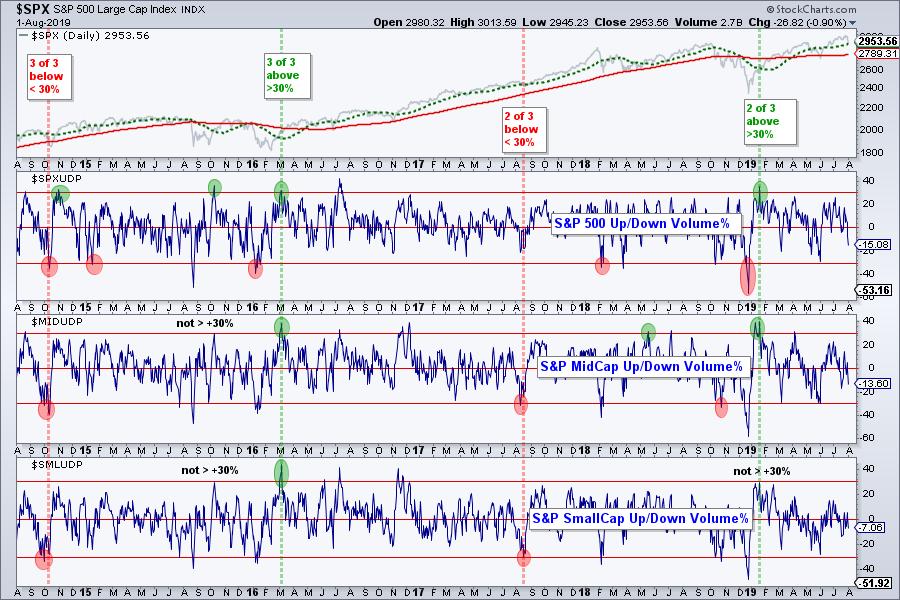
We can add a moving average to AD Percent and Up/Down Volume% to generate longer term signals. Applying a 10-day EMA, a signal generates with a cross above +30% or below -30%. The group turns net bullish or bearish when at least two of the three trigger signals. The green/red shaded ovals on the chart below mark the initial signals for each index indicator, while the green/red dashed lines show when at least two of the three triggered signals. Note that only the initial signals are marked. Subsequent signals simply confirm an existing signal so they are not marked. As a group, the indicators triggered eight signals over the last five years:
- September 2014 (net bearish)
- October 2014 (net bullish)
- August 2015 (net bearish)
- October 2015 (net bullish)
- January 2016 (net bearish)
- March 2017 (net bullish)
- February 2018 (net bearish)
- January 2019 (net bullish)
AD Percent is the hair trigger indicator that can be prone to whipsaws. There were whipsaws or bad signals in September 2014, October, 2015 and January 2016. The indicators fell into negative territory this week, but remain well short of a bearish breadth thrust signals, which would require a move below -30%.
The next chart shows the 10-day EMA of Up/Down Volume% for the same three indexes with four signals over the last five years. Keep in mind that only the initial signals are marked for each index (red/green oval) and the group (red/green lines).
Stocks Making Highs or Lows
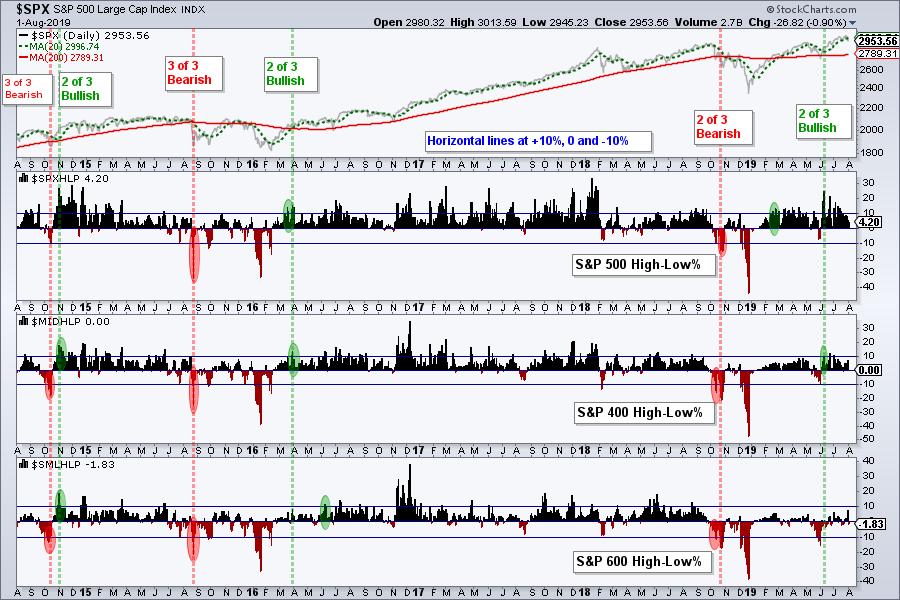
High-Low Percent is less trigger happy than AD Percent and works as a good counterbalance. High-Low Percent, or the percentage of Net New Highs, reflects the percentage of stocks in strong uptrends or downtrends. High-Low Percent = New 52-week Highs less New 52-week Lows divided by total issues. Relative to AD Percent, High-Low Percent is a lagging indicator with fewer signals. The indicator turns bullish with a move above +10% and bearish with a move below -10%. These levels show enough critical mass to generate bullish and bearish signals.
The chart below shows six group signals over the last five years. There was a whipsaw after the bearish signal in October 2014 as the indicator group turned bullish a month later. The other signals triggered later than the 10-day EMA for AD Percent. Currently, S&P 600 High-Low% ($SMLHLP) remains with an active bearish signal from October 2018 because it has yet to exceed +10%. S&P 500 High-Low% ($SPXHLP) triggered bullish in February and S&P 400 High-Low% ($MIDHLP) triggered bullish in June. As a group, these indicators are still in bull mode.
In a separate, but related comment, note that I am not interested in divergences or warning signs. I am simply interested in bullish or bearish signals. Furthermore, I am not concerned with the degree of bullishness after a bullish signal or the degree of bearishness after a bearish signal. I am simply keeping it simple. The indicator is either on an active bullish signal or an active bearish signal.
Stocks in Long-term Uptrends
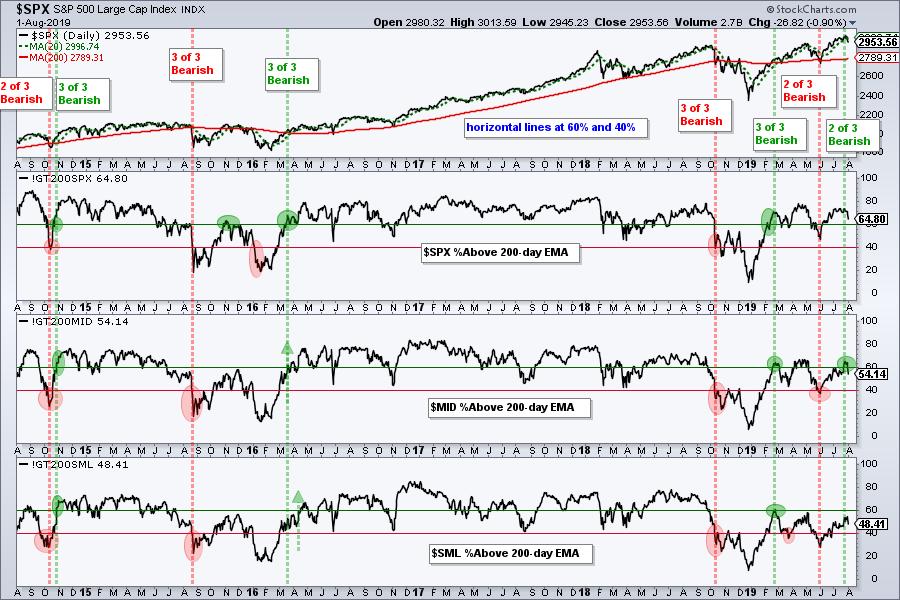
The last group shows the percentage of stocks in each index that are above their 200-day EMAs, which reflects the percentage of stocks in uptrends of some sort. A bullish signal triggers when this indicator moves above 60% (green oval) and this is negated when the indicator moves below 40% (red oval). The red and green dashed lines show when the group turns net bullish or net bearish and there were eight signals over the last five years. As with most trend-following type signals, there were whipsaws and good signals. The indicator managed to turn bearish from August 2015 to February 2016 and then caught the big market advance from March 2016 to October 2018.
Putting it All Together
Now it's time to put AD Percent, High-Low Percent and %Above 200-day EMA together. Up/Down Volume% is not part of my long-term market model group right now. I think it is important to combine different and complementary indicators when building a broad market model. It is also important to have an odd number of indicators to avoid a tie!
Right now the model is bullish with seven of nine indicators on bullish signals (78%). Three of three S&P 500 and S&P Mid-Cap 400 indicators are bullish, while only one of three S&P Small-Cap 600 indicators are bullish. Small-caps remain the laggards because two of the three indicators are on active bearish signals.

This model is not concerned with relative weakness in small-caps as long as the majority of indicators are bullish, and they are. Relative weakness in small-caps simply means to avoid the small-cap indexes and be careful with small-caps.
State of Stock Market Video
This week's video was produced on Thursday and featured in On Trend. Topics covered include:
- Quantifying Selling Pressure
- Weekly Charts for SPY, QQQ, MDY and IWM
- Breadth and Sector Table Update
- Gold, Bonds, Dollar and Oil
Questions, Comments or Feedback?
Email: arthurh(at)stockcharts.com
Twitter: @arthurhill
Art's Charts ChartList Update
The Art's Charts ChartList has been updated with 30 curated stock charts. These charts were selected based on observations this week and the RSI-Aroon chart scan in this System Trader article. Some charts remain from week to week and some change. The idea is to provide a curated list of stocks to watch for the week(s) ahead.
Click here for the Art's Charts ChartList
-----------------------------------------------------------------------------
Choose a Strategy, Develop a Plan and Follow a Process
Arthur Hill, CMT
Chief Technical Strategist, TrendInvestorPro.com
Author, Define the Trend and Trade the Trend
Want to stay up to date with Arthur's latest market insights?
– Follow @ArthurHill on Twitter

