Stocks rebounded on Friday with small-caps leading the way. The Russell 2000 surged 2.19%, while the S&P 500 advanced 1.44% and the Nasdaq 100 gained 1.59%. Despite these sizable rebounds, all three were down for the week and still down between 4.5% and 5.5% over the last three weeks. The S&P 500 and Nasdaq 100 fell from new highs and remain around 5% below their all time highs. The Russell 2000, on the other hand, peaked in August 2018 and remains some 14% below this high.
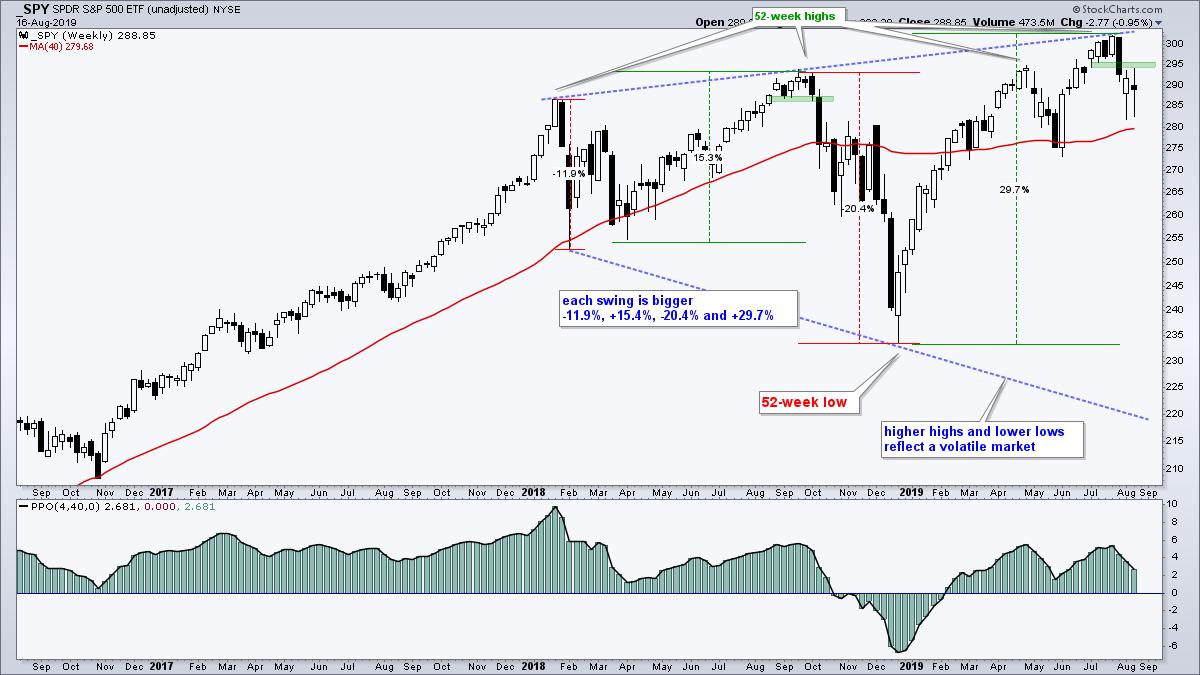
The first chart shows the S&P 500 SPDR (SPY) and we can still make the case for a long-term uptrend, despite the August support break around 295 and the ominous broadening formation. The ETF is above its 40-week SMA and the PPO(4,40,0) is positive, which means the 4-week EMA is above the 40-week EMA. After breaking short-term support in early August, the ETF managed to stabilize the last two weeks and formed a spinning top candlestick this week. These candlesticks signal indecision, but price action is still below the short-term support break so we have yet to see buyers step back in force.
------------------------------------------------------------
Edwards, Magee and the Broadening Formation
In their classic book, Technical Analysis of Stock Trends (10th Edition), Robert Edwards and John Magee, describe the broadening formation as follows:
If the Symmetrical Triangle presents a picture of "doubt" awaiting clarification, and the Rectangle a picture of controlled "conflict", the Broadening Formation may be said to suggest a market lacking intelligent sponsorship and out of control - a situation, usually, in which the "public" is excitedly committed and which is being whipsawed by wild rumors.
I guess you could replace rumors with tweets! The more things change, the more they stay the same. They also note:
The very fact that chart pictures of this type make their appearance, as a rule, only at the end or in the final phase of a long Bull Market lends credence to our characterization of them....while further advance in price is not ruled out, the situation is, nevertheless, approaching a dangerous stage.
Even though SPY is still in an uptrend overall, I turned bearish on the market because my index breadth model is net bearish and the sector breadth model is barely positive. At the very least, I am not bullish on the broader market right now. As noted on Thursday (here), five of the nine index indicators are on active bearish signals since August 14th and this reverses the bullish signal from February 15th. The sector breadth model was updated in Friday's commentary (here). Even though it remains net positive (+8.34%), it is near the middle of its range (-100% to +100%). In addition, four of the five offensive sectors are net bearish (Finance, Communication Services, Industrials and Consumer Discretionary). I cannot be bullish on the broader market when the breadth indicators for these key sectors are net bearish.
------------------------------------------------------------
QQQ Holds Key Retracement
The next chart shows QQQ falling from a 52-week high in early August and then bouncing off the 61.8% retracement (180 area). QQQ held up better than most because it did not come close to its early June low and formed a higher low from early August to mid August. Nevertheless, I am concerned that a pennant is taking shape and the second shoe could still drop. Note that the pennant lines are based on closing prices. Thus, a close below 182.5 would confirm the pennant and signal a continuation of the early August decline. This would target a move towards the 170-175 area.
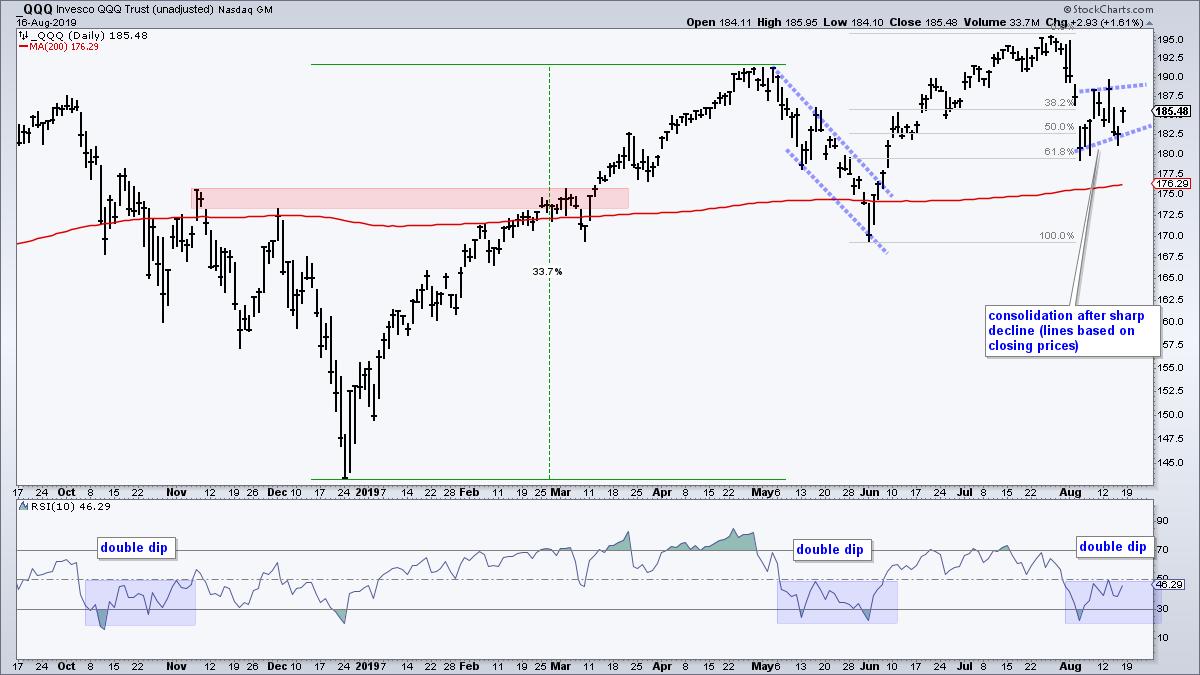
The indicator window shows RSI(10) with double dips in October and May. The two dips below 30 represent two declines, the second of which is the second shoe falling. Notice that RSI failed at 50 in mid May and is struggling at 50 here in mid August. A second dip below 30 could be coming.
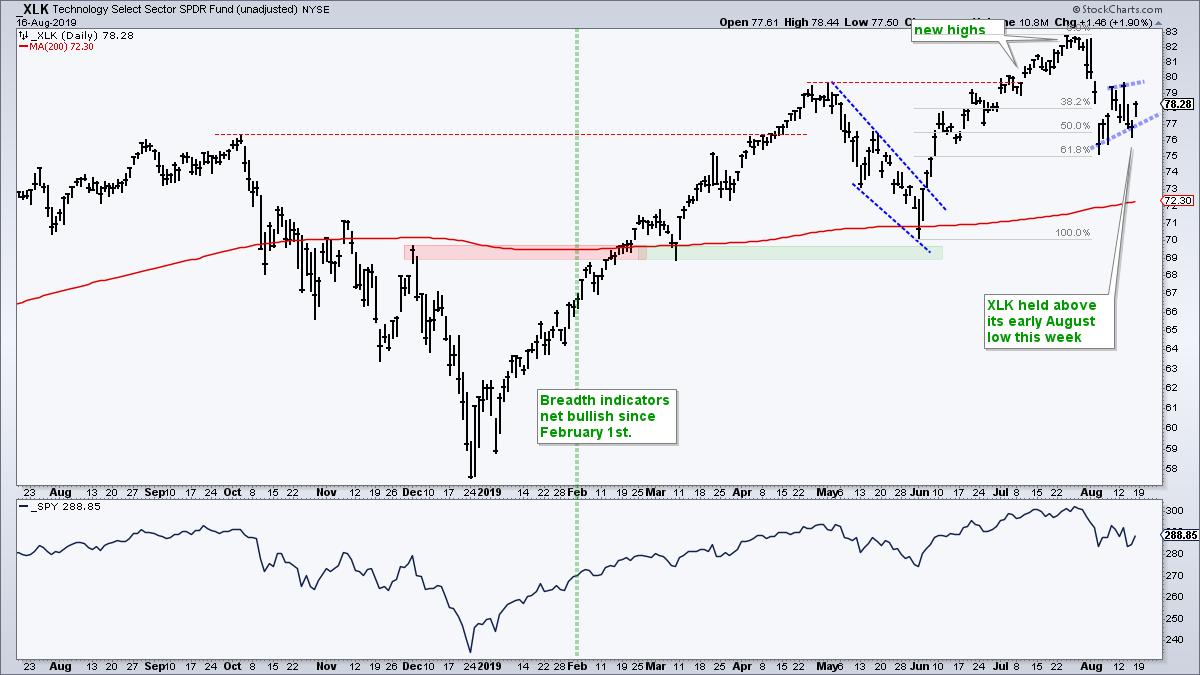
The Technology SPDR (XLK) is the only offensive sector that is net bullish on the breadth table (see Friday's commentary). It also does not look too bad on the price chart. This is one to watch because XLK accounts for 22% of the S&P 500 and is by far the biggest sector. The price chart looks similar to QQQ with new highs in July, a 61.8% retracement in early August and a higher low from early August to mid August. However, a rising wedge or pennant consolidation is taking shape (blue lines). This is a bearish continuation pattern and a close below 76.8 would signal that the second shoe is dropping. Weakness in the largest sector would certainly weigh on the broader market so watch this one closely.
------------------------------------------------------------
Choose a Strategy, Develop a Plan and Follow a Process
Arthur Hill, CMT
Chief Technical Strategist, TrendInvestorPro.com
Author, Define the Trend and Trade the Trend
Want to stay up to date with Arthur's latest market insights?
– Follow @ArthurHill on Twitter


