 As noted in a separate commentary, the State of the Stock Market is shaky. The Technology sector is holding up, but we are seeing weakness within Finance, Consumer Discretionary, Industrials and Communication Services. The Technology sector is the biggest sector in the S&P 500 SPDR (22%) and EW S&P 500 ETF (14.22%). As such, it holds an important key to the broader market moving forward. Before looking at this key sector and some tech-related industry group ETFs, let's compare recent price performance for the EW S&P 500 ETF (RSP) and SPY.
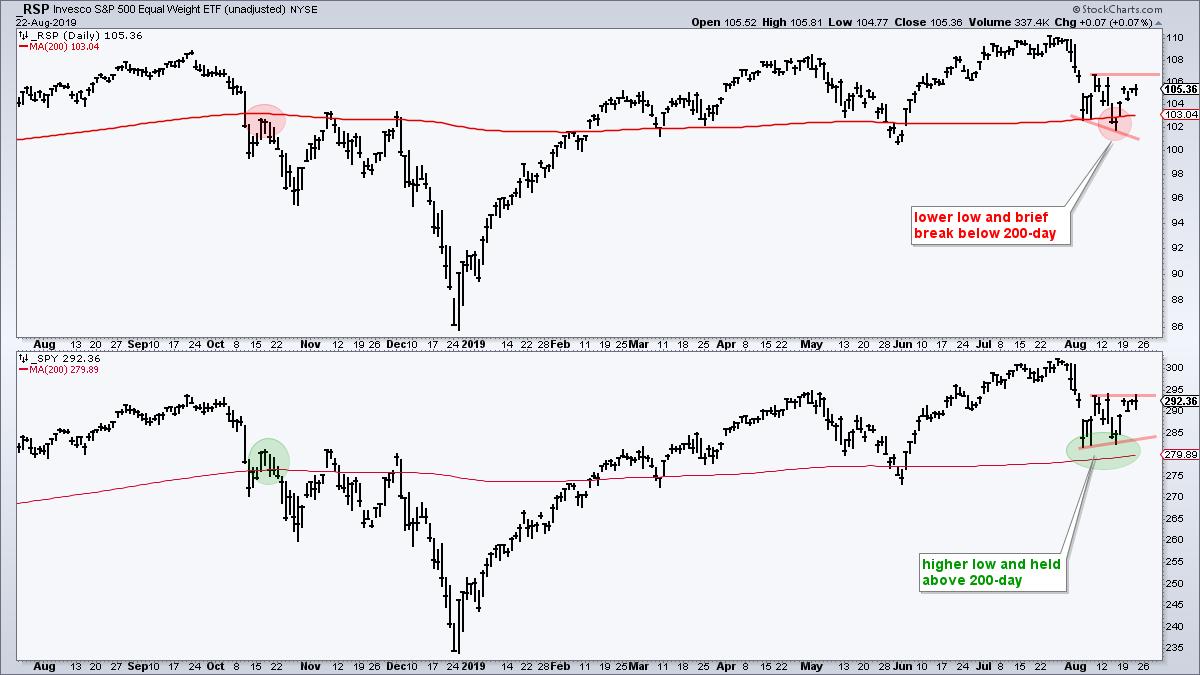
The chart above shows RSP breaking below its 200-day, forming a lower low in August and falling short of the early August high this week. In contrast, SPY held above its 200-day, formed a higher low in August and got back to the early August high.
There are two ways to interpret this. First, the average large-cap is leading the average stock in the S&P 500. Second, the average stock is lagging the average large-cap. Either way, the average stock looks weaker than the average large-cap and this shows weakness under the surface.
------------------------------------------------------------
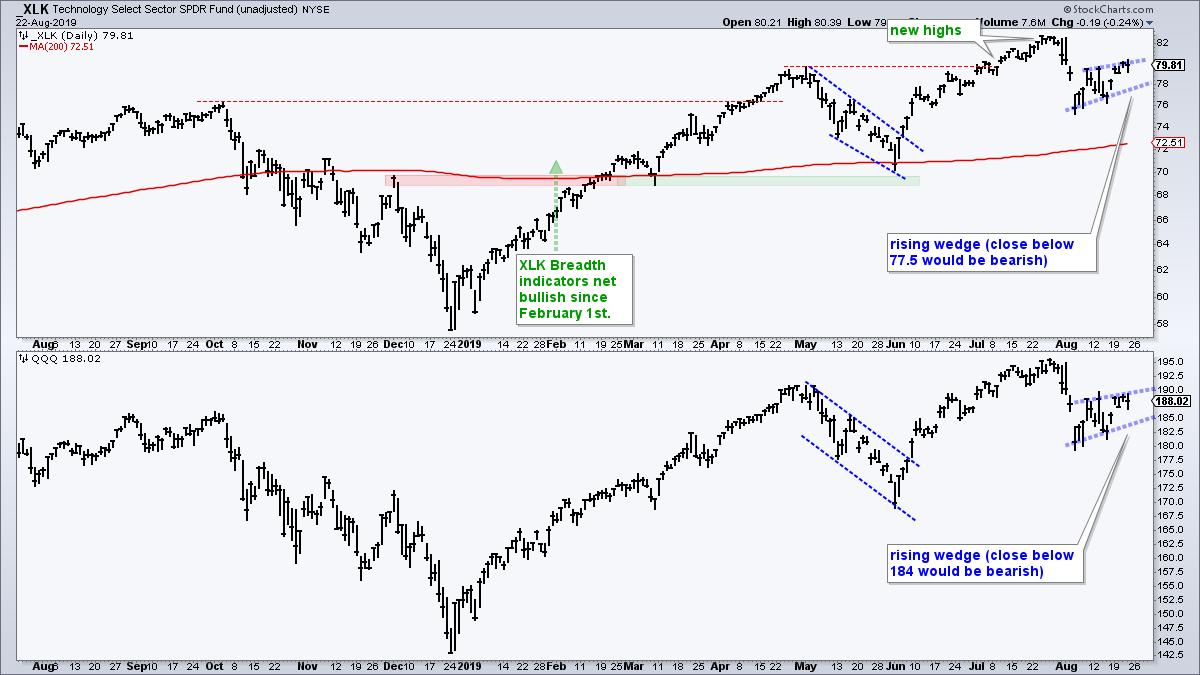
Watching the Wedges in QQQ and XLK
I do not like to think bearish thoughts when the bigger trend is up, but I will point out the rising wedges in QQQ and XLK because the broad market environment is mixed, at best. Note that QQQ and XLK are in long-term uptrends and holding up rather well. After the early August plunge, both formed rising wedges the last three weeks. The immediate trend is up as long as these wedges rise. Note that the wedge lines are based on closing prices and a close below the lower line would be bearish.
------------------------------------------------------------
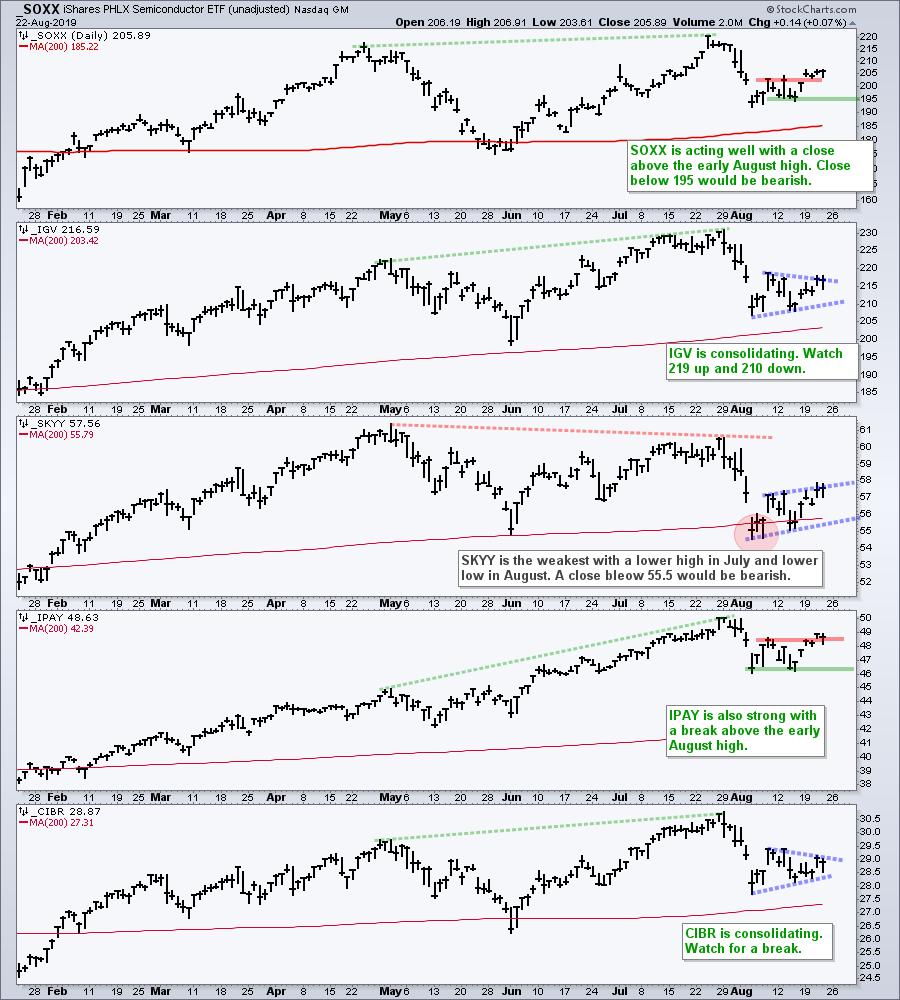
SOXX and IPAY Stand Out
The next chart shows five tech-related ETFs. ETFs that hit new highs in July and held above the early June lows during the August decline are leading (SOXX, IGV, IPAY, CIBR). ETFs that formed lower highs in July and broke their early June lows are lagging (SKYY). SOXX and IPAY broke above their early August highs this week and are leading short-term. IGV and CIBR formed pennant consolidations that need to be monitored for the directional break.
------------------------------------------------------------
Leading ETF Groups
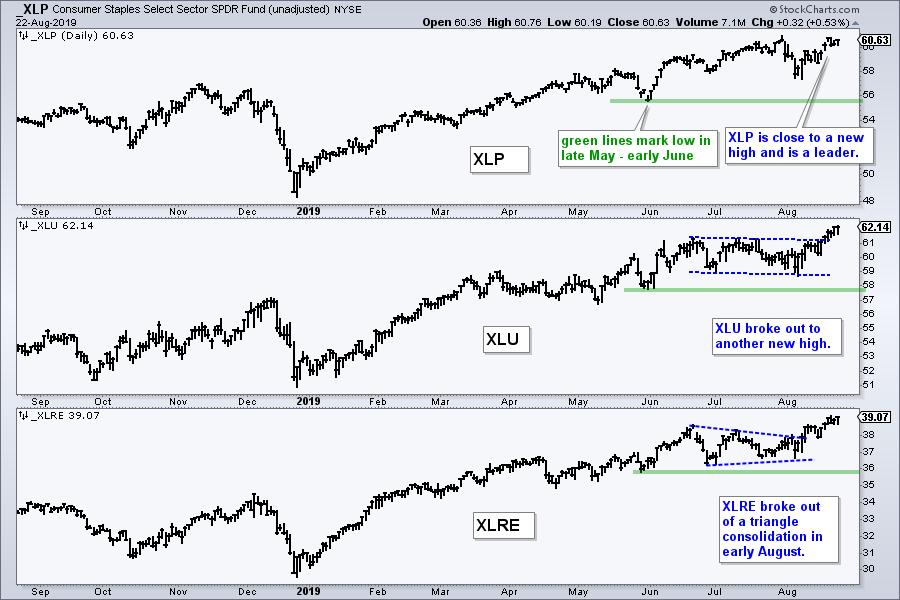
ETFs focused on bonds (TLT, AGG), bond proxies (XLU, XLRE), low volatility (SPLV, USMV) and gold (GDX, GLD) are leading the market right now. Note that covered TLT and GLD in ChartWatchers. We can also throw in the US Dollar ETF (UUP), which is in a strong uptrend. The chart below shows XLP near a new high this week, XLU breaking out last Friday and XLRE breaking out in early August. These three are the clear sector leaders right now.
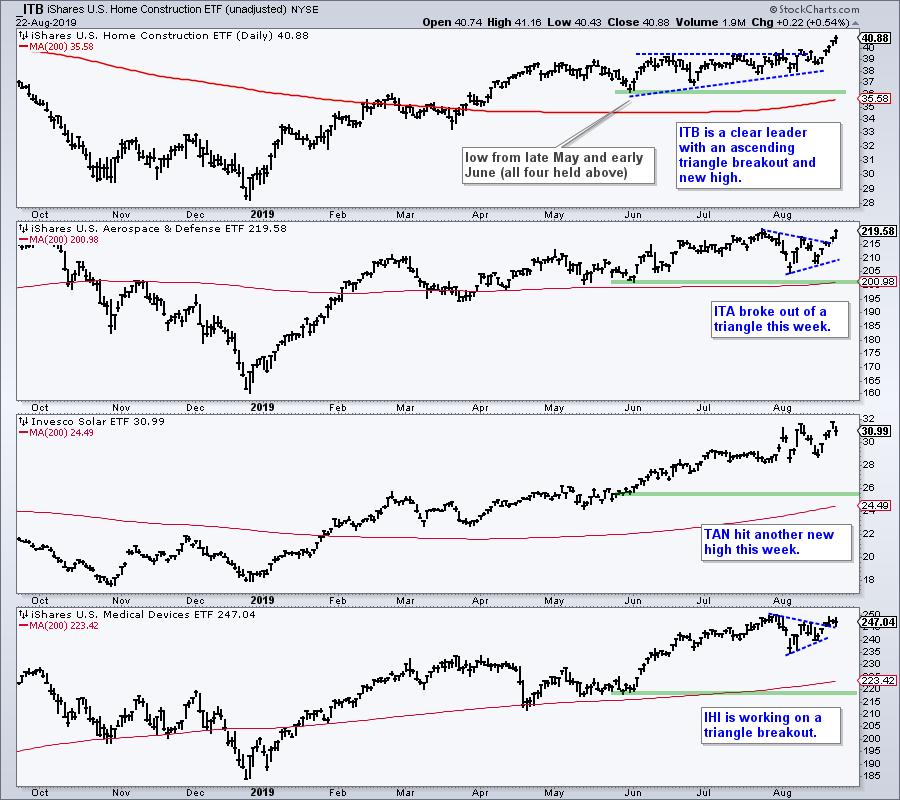
Outside of these defensive groups, I am seeing continued strength in the Home Construction iShares (ITB), Aerospace & Defense iShares (ITA), Solar Energy ETF (TAN) and Medical Devices ETF (IHI). Yep, the pickings are getting slim. All four are shown on the chart below. They all hit new highs in July, while ITB and TAN hit new highs again this week. ITA and IHI broke out of triangle consolidations this week.
------------------------------------------------------------
Laggards and Downtrends
And finally, there are the laggards and downtrends: XLE, XRT, KBE, KRE, REM, MJ, IHF, FCG, XES, XOP, AMLP, XME, REMX, IYZ, DBC, EEM. I am not even going to show these charts because I am not a bottom picker and I respect the overall trend. You can copy this symbol list and view as CandleGlance charts. IBB and XBI held above their early June lows, but they are also lagging overall and not on my radar.
------------------------------------------------------------
Choose a Strategy, Develop a Plan and Follow a Process
Arthur Hill, CMT
Chief Technical Strategist, TrendInvestorPro.com
Author, Define the Trend and Trade the Trend
Want to stay up to date with Arthur's latest market insights?
– Follow @ArthurHill on Twitter


