
Today I will expand and update the key breadth indicators for the S&P 500. Notably, I added two more early warning indicators to the mix. They have yet to trigger, but these added indicators will give us something to watch going forward.
I will also update the charts for the big three (SPY, QQQ, IWM) and show why the Technology sector is under pressure. This is a big deal because Technology (22%) is the largest sector in the S&P 500. Healthcare is the second largest (13.6%) and it sports the smallest gain (4.52%) of the eleven sectors this year. This means its relative performance is the weakest and it is NOT pulling its weight.
As an aside, the Russell 2000 has a total market cap in the area of $2.41 trillion. According to the CME, the Russell 2000 accounts for 7.6% of the Russell 3000, which had a total market cap of 31.7 trillion at the end of July. For reference, the Russell 2000 market cap is less than the combined market cap of Microsoft ($1.05 trillion), Apple ($989 billion) and Google ($850 billion). Yes, the Russell 2000 is really really small.
------------------------------------------------------------
The Big Five Breadth Chart
Normally I use three breadth indicators for a weight of the evidence approach. Today, I would like to show you a strategy using five breadth indicators. The next paragraph explains the indicators and the key levels. I set the signal thresholds to trigger when there are signs of significant strength or weakness in these indicators.
In the first group we have the 10-day EMA of Advance-Decline Percent and Up-Down Volume Percent. A move above +30% is bullish, while a move below -30% is bearish. Second, High-Low Percent triggers bullish with a move above +10% and bearish with a move below -10%. Third, the Percentage of Stocks Above the 200-day EMA triggers bullish with a move above 60% and bearish with a move below 40%, while the Percentage of Stock Above the 50-day EMA triggers bullish with a move above 80% and bearish with a move below 20%. Keep in mind that these bullish and bearish thresholds are designed to capture significant shift and ignore the wiggles in between.
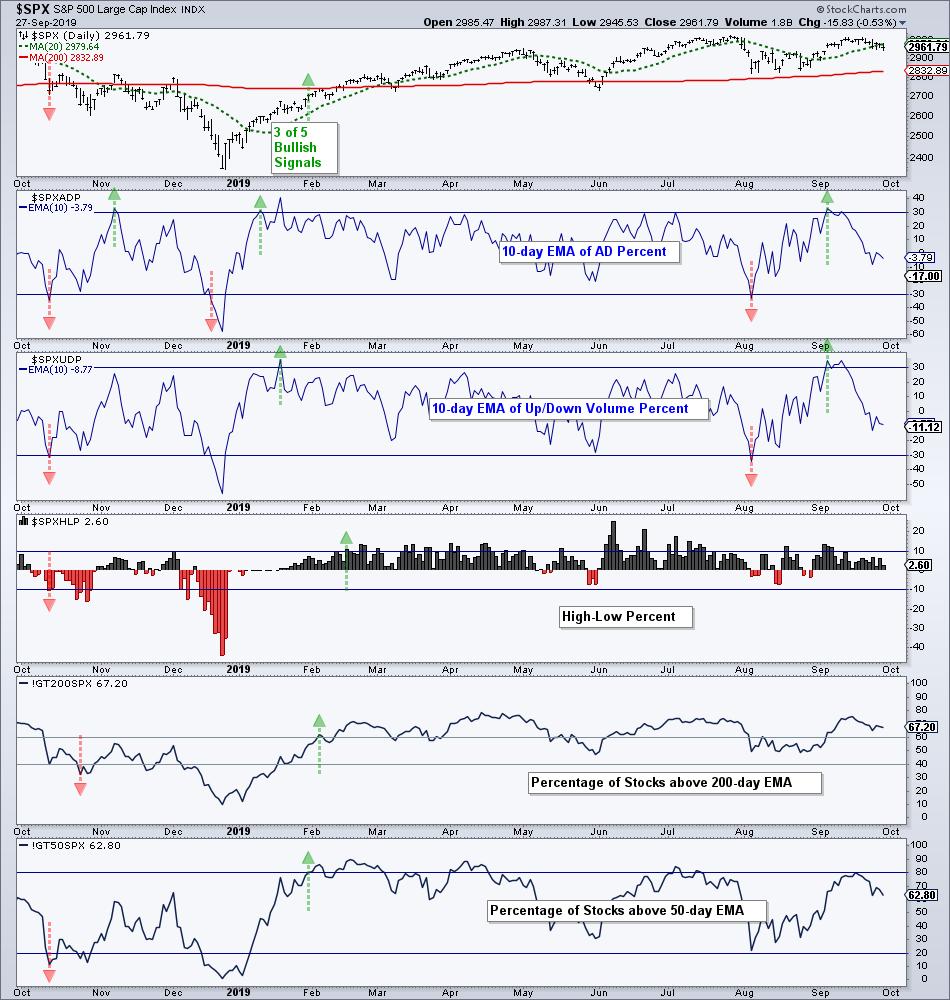
I have not backtested this model, but plan on running some test in the coming months. As with any model, it is not perfect, but it gives me a framework and process to evaluate the S&P 500 in an objective manner. Currently, all five indicators are on active bullish signals. The 10-day EMAs of Advance-Decline Percent and Up-Down Volume Percent triggered bearish in early August, but flipped back to bullish in early September. These two are the most sensitive and are often the first to trigger. The %Above 50-day EMA is the next most sensitive and often the third to trigger. All three are bullish now, but I will be watching these closely.
Charting Tip: You can chart these same indicators for the S&P 600 SmallCap Index ($SML), S&P 400 MidCap Index ($MID) and Nasdaq 100 ($NDX). Simply replace the index portion of the symbol. S&P 500 AD Percent ($SPXADP) turns into S&P 600 SmallCap Advance-Decline Percent ($SMLADP) by using $SML instead of $SPX.
------------------------------------------------------------
SPY Testing Breakout Zone
Long-term, there is no change on the S&P 500 SPDR (_SPY) chart. The trend is still up and the bulk of the evidence remains bullish. I do not consider the July high as resistance because the bigger trend is up and resistance levels are not important in uptrends. Support levels, on the other hand, are important because they hold the key to the uptrend. A break below the August low would forge a lower low and reverse the uptrend.
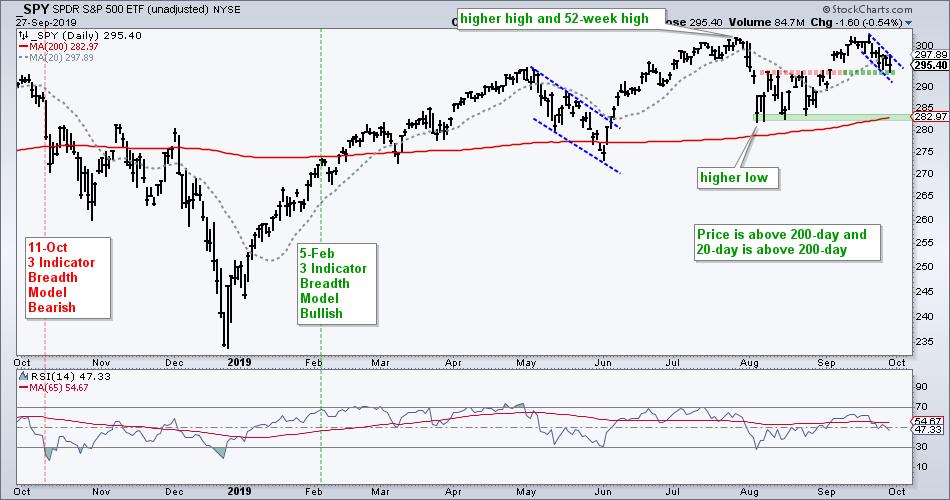
Short-term, the S&P 500 SPDR (_SPY) fell the last six days and is testing its breakout zone. Also note that the 6-day decline represents a 50% retracement of the 6% surge from August 26th to September 12th. A falling flag could be taking shape and a breakout at 298 would reverse the short-term slide.
------------------------------------------------------------
QQQ is Weaker than SPY
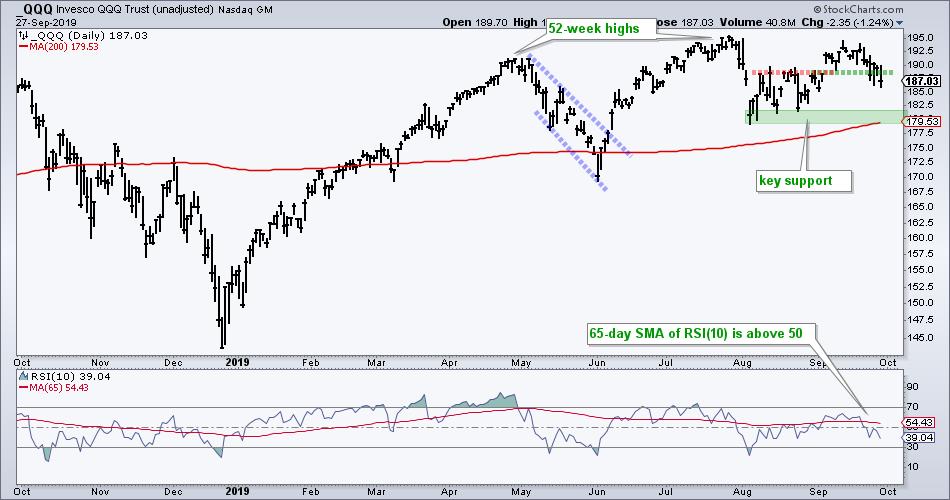
The Nasdaq 100 ETF (_QQQ) is weaker than SPY because it fell back below the breakout zone and did not hold the September 5th gap. Relative weakness in QQQ is a concern because it represents the Technology sector and this is the biggest sector in the stock market. Despite a lower high from June to September, the bigger trend is still up on this chart. The August lows mark support and a break below this level would be bearish.
------------------------------------------------------------
IWM Remains in Downtrend
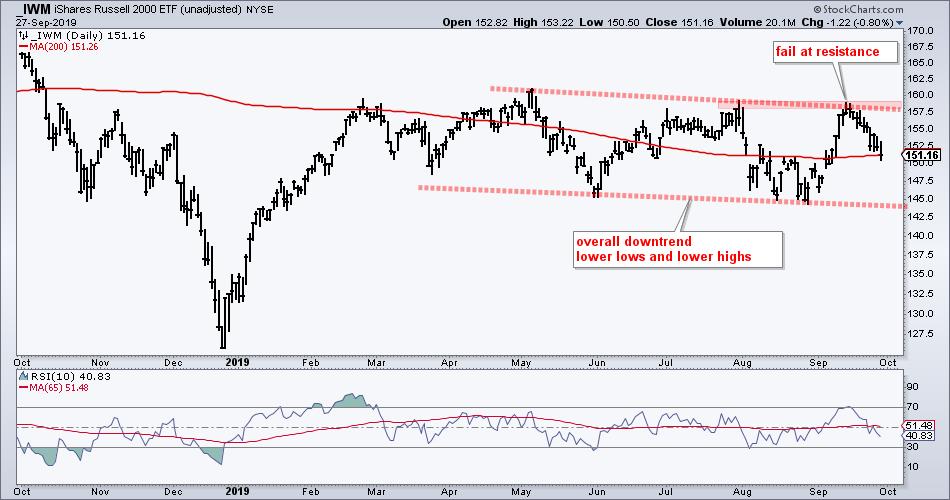
In contrast to SPY and QQQ, which remain in uptrends, the Russell 2000 ETF (_IWM) is in a downtrend and resistance IS important. Resistance levels are expected to hold in a downtrend. Support levels, on the other hand, are not expected to hold and lower lows are expected. The chart below shows IWM failing in the resistance zone with a sharp decline the last 9 days.
------------------------------------------------------------
Thank Goodness for SOXX
The Technology SPDR (_XLK) would be in a lot worse shape were it not for the Semiconductor ETF (_SOXX). The chart below shows six key tech-related ETFs. SOXX bounced back to its July high and then fell back the last two weeks. The ETF remains well above its August low and still in an uptrend overall. The Mobile Payments ETF (_IPAY) and FinTech ETF (_FINX) are still in uptrends, but both are back near their August lows.
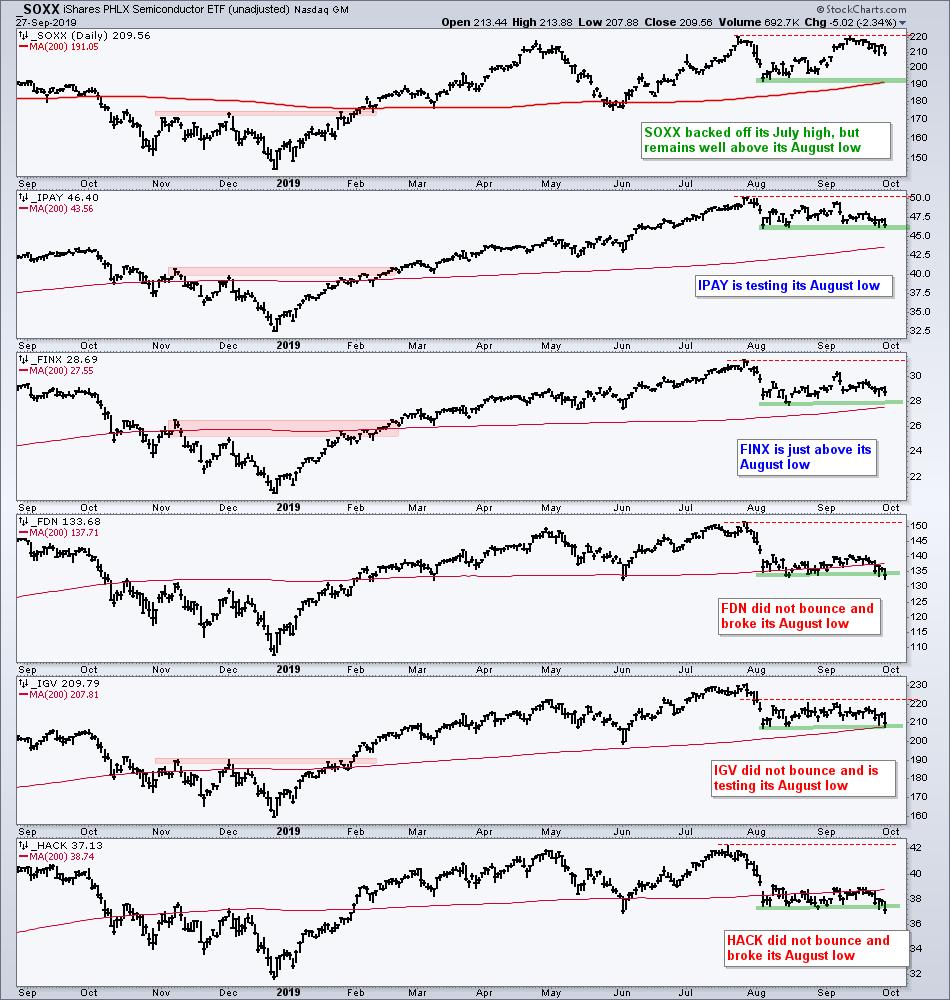
The Internet ETF (_FDN), Software ETF (_IGV) and Cyber Security ETF (_HACK) represent the industry culprits within the Technology sector. These three did not bounce with the market in August-September. Instead, they just consolidated, which represents a stalemate between buying pressure and selling pressure. Selling pressure is getting the edge now because FDN and HACK broke consolidation support and IGV is testing its August low.
------------------------------------------------------------
This Week on Art's Charts
Friday - 27-Sept: The State of the Stock Market - It is What it is
Thursday - 26-Sept: ETF Ranking and Grouping - Staples and Utes Leading, while Software and Biotech Looking Vulnderable
Wednesday - 25-Sept: There May be Trouble Ahead - SPY, QQQ and IWM Update
------------------------------------------------------------
Choose a Strategy, Develop a Plan and Follow a Process
Arthur Hill, CMT
Chief Technical Strategist, TrendInvestorPro.com
Author, Define the Trend and Trade the Trend
Want to stay up to date with Arthur's latest market insights?
– Follow @ArthurHill on Twitter


