 My headlines are often inspired by tunes, and this one is a classic going back to 1936 and Fred Astaire. No, I am not old enough to have seen it live on TV, but I've heard plenty of remakes. Even though there may be trouble ahead, I am not sure if I want to face the music and dance. As a market timer, this seems like a good time to hit the bar and have a drink. In other words, lighten up and take a load off my feat.
This post is a follow up to Saturday's post on "What to Watch for the Week Ahead". Overall, small-caps are still lagging with the Russell 2000 ETF failing at resistance, and still in a downtrend overall. The Nasdaq 100 ETF fell rather hard the last three days and filled the September 5th gap. Perhaps most important of all, three of the five offensive sectors are lagging in September.
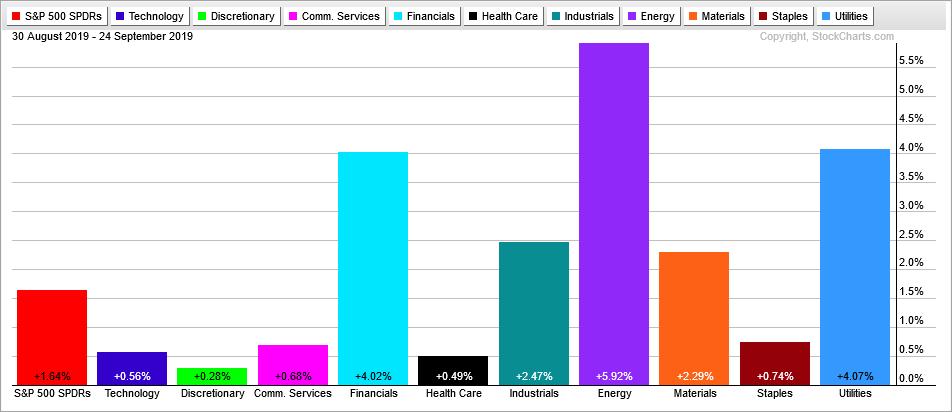
The PerfChart below shows the Technology SPDR (blue), the Consumer Discretionary SPDR (green) and the Communication Services SPDR (magenta) up less than 1% in September and seriously lagging the S&P 500 SPDR. In addition, the Healthcare SPDR, which is the second biggest sector in the S&P 500, is also lagging. This means four of the six biggest sectors are lagging in September. Forget about small-caps, these four sectors account for much more market cap than the Russell 2000 and carry some serious weight.
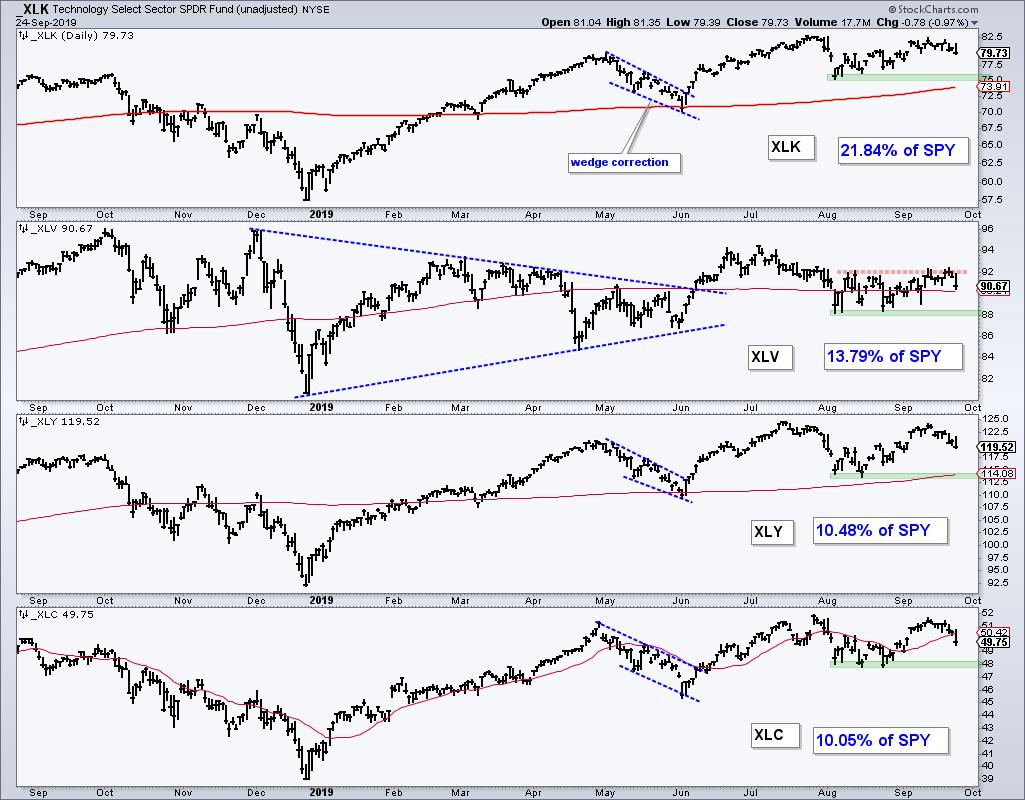
The chart below shows four lagging sectors (XLK, XLV, XLY, XLC). Together, these account for over 55% of SPY. Note that XLK, XLY and XLC did not exceed their July highs. XLV fell well short of its July high and is the weakest of the four.
------------------------------------------------------------
Programming Note: My "normal" publishing schedule is Thursday, Friday and Saturday, and aimed at the weekend trader/investor. Thursday features the ETF rankings and groups, along with chart analysis. Friday features the State of the Stock Market with the Index and Sector Breadth Models. Saturday is a wild card to tie up loose ends and preview the week ahead. Today's update is a bit early because market conditions warrant an update.
------------------------------------------------------------
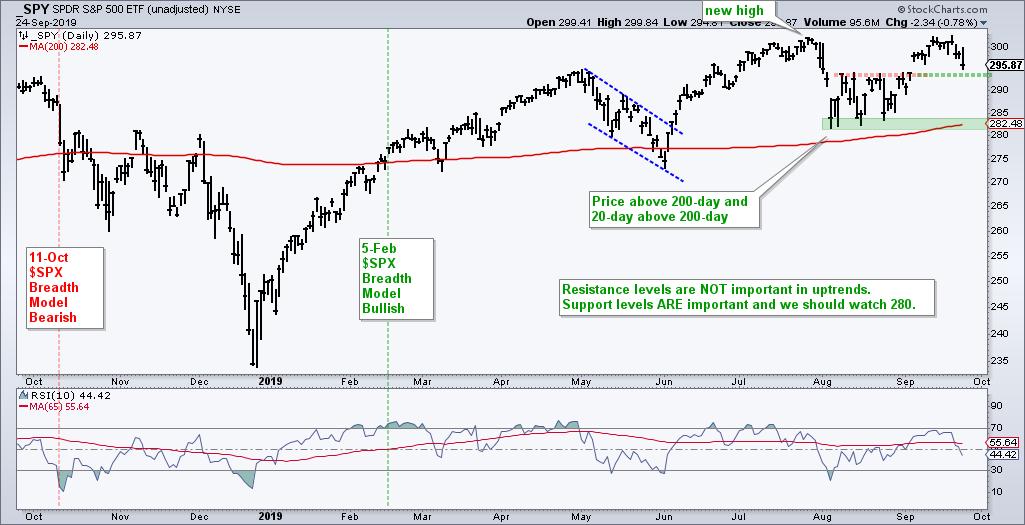
The next chart shows SPY backing down near the July high. The overall trend is still up and the ETF is challenging the September 5th breakout. A close below 294 would fill this gap and negate the breakout. Top pickers would then start clamoring for a double top, which is entirely possible, but would not be confirmed until SPY closes below 280. Such a move, combined with bearish signals in the Index Breadth Model, would argue for a reversal of the uptrend.
------------------------------------------------------------
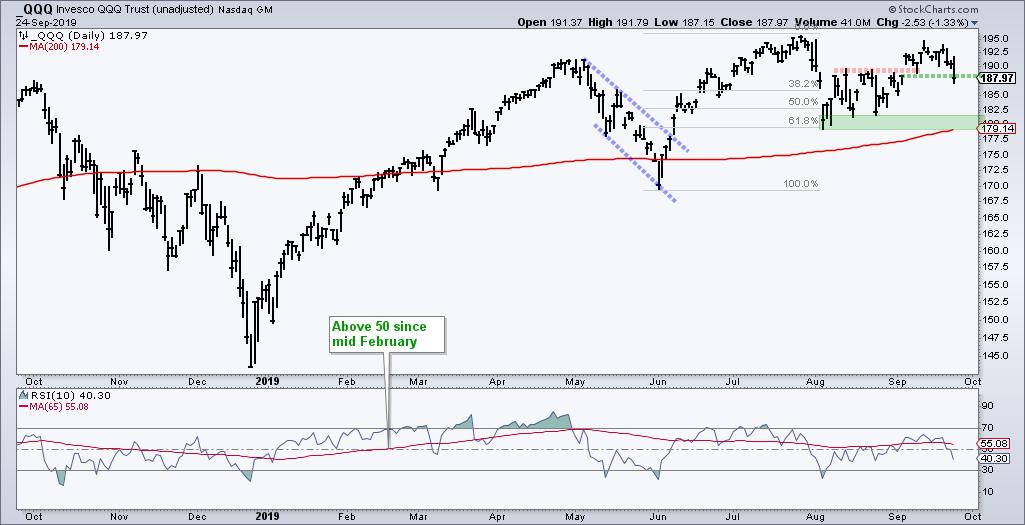
The next chart shows QQQ falling just short of its July high and closing below the September 4th close, which means the ETF filled the gap on September 5th. This was the breakout heard round the world and it has failed. Note that QQQ is down 1.44% since August 1st and SPY is essentially flat (-.07%). QQQ is lagging and this is a big deal because there are some big important stocks in QQQ. The August low and rising 200-day SMA mark double top support and a close below 179 would confirm this pattern, and reverse the uptrend.
------------------------------------------------------------
Now we get to the three weaklings: the S&P 400 MidCap ETF (MDY), the Russell 2000 ETF (IWM) and the S&P 600 SmallCap ETF (IJR). MDY has gone nowhere since May and failed at resistance from the April-July highs. IJR made it above its late July high, but did not exceed its February or April highs. Thus, the resistance zone held as IJR turned down sharply the last five days. IWM also failed in the resistance zone.
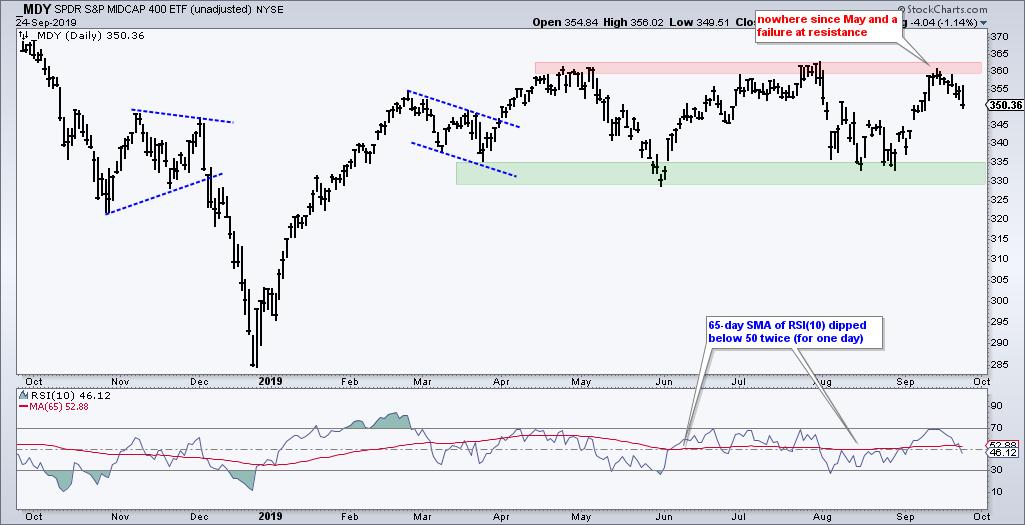
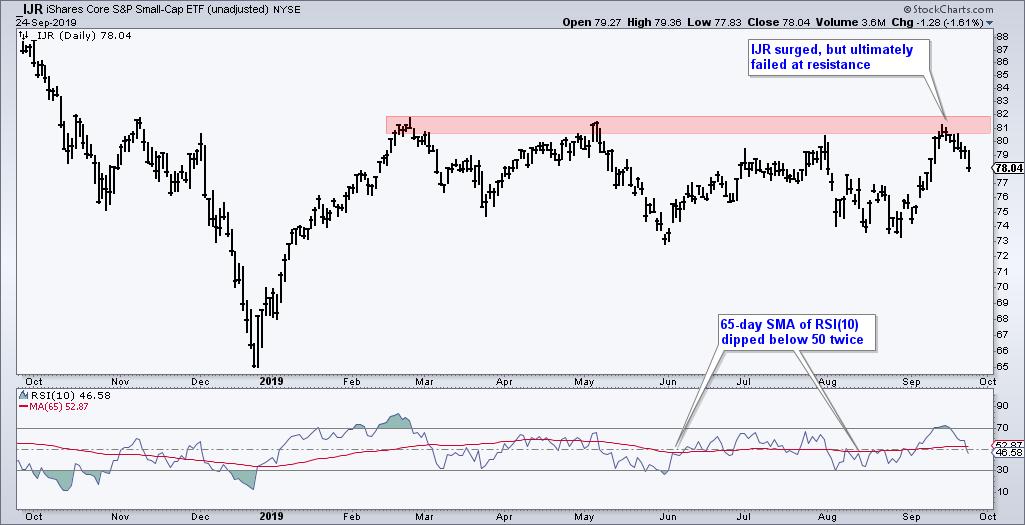
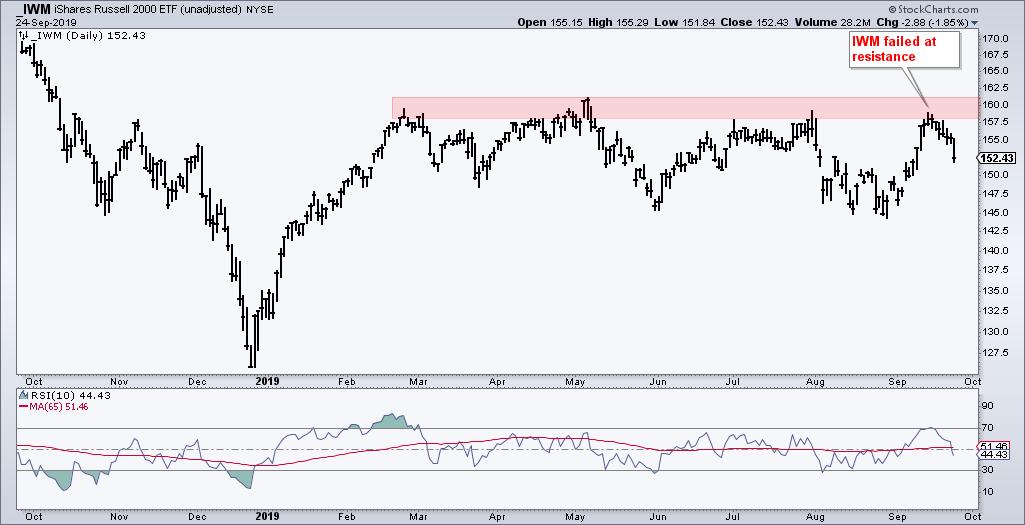
Not only did all three of these ETFs fail at resistance from the highs of the last few months, but they also fell well short of their 2018 highs. IWM is 12% below its September 2018 high, IJR is around 14% below this high and MDY is 6.5% below this high. These three have been lagging for a long time. SPY,
------------------------------------------------------------
Correlations and Broad Market Weakness
The S&P 500 SPDR, Nasdaq 100 ETF, Technology SPDR, Consumer Discretionary SPDR, Communications Services SPDR and Healthcare SPDR were leading the market in July, but are now looking shaky as they turn down just below their July highs. Even though my Index and Sector Breadth Models remain bullish, relative weakness in large-caps (SPY), large-techs (QQQ) and big sectors is a big deal and it is not a good sign for the broader market.
Should these names fall further and test their August lows, I would expect correlations to rise in the stock market. What does this mean? It means I would expect more stocks to participate should be see further weakness. How far a decline might extend is anyone's guess. As the charts above show, the August lows mark important support levels going forward. I will refrain from turning bearish until we see support breaks from SPY, QQQ and the four big sectors, as well as bearish turn in the Index Breadth Model.
Develop a Plan, Implement a Process and Take Your Signals.
------------------------------------------------------------
Choose a Strategy, Develop a Plan and Follow a Process
Arthur Hill, CMT
Chief Technical Strategist, TrendInvestorPro.com
Author, Define the Trend and Trade the Trend
Want to stay up to date with Arthur's latest market insights?
– Follow @ArthurHill on Twitter


