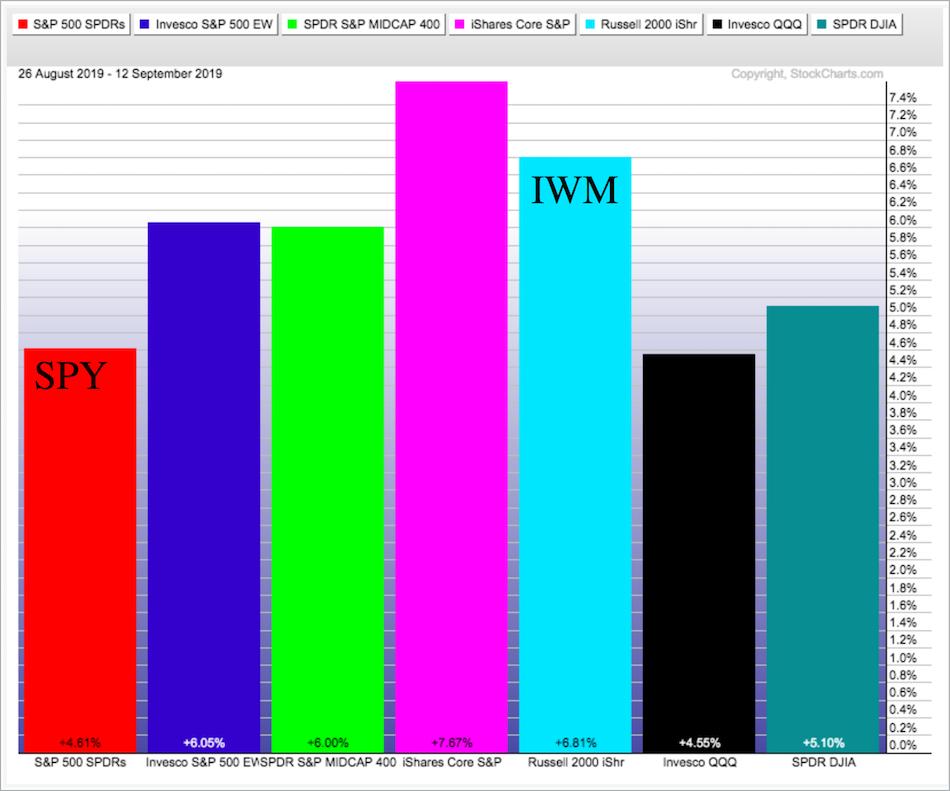
Stocks surged the last 12 days with small-caps leading the way higher. The Russell 2000 iShares (IWM) is up 6.8% and the S&P 500 SPDR (SPY) is up 4.6%. Even though small-caps are leading short-term, they are still lagging on the three and six month timeframes. At this point, I am not going to read too much into short-term leadership from small-caps. In other words, I need to see more before getting excited about small-caps. Large-caps are still the "real" leaders in the stock market.
------------------------------------------------------------
Programming Note
Note that I am on vacation this week, but found a window to update the Index Breadth Model, SPY and IWM. Vacations in September are always challenging from a stock market perspective, but once-in-a-lifetime chances come first. Take them when you can! For a little background, I am married to a Belgian and am based in Belgium. My son graduated high school this year and starts university in late September. We are doing a road trip through south-central Texas with three of his friends as they transition from high school to university. So far we hit Austin, Enchanted Rock, Pedernales Falls, the Comal river, Threadgill's, Rudy's, Chuy's, La Grange (ZZ Top) and Houston. I will have another commentary window on Friday when they visit NASA and be back in the swing next week.

------------------------------------------------------------
Index Breadth Model Takes a Leap
The next two charts show two new bullish signals for the Index Breadth Model.
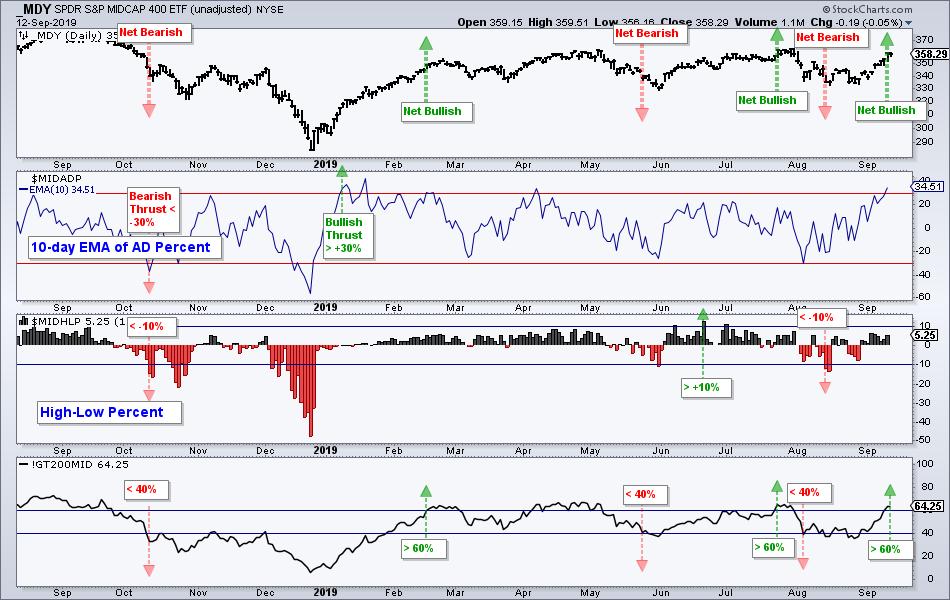
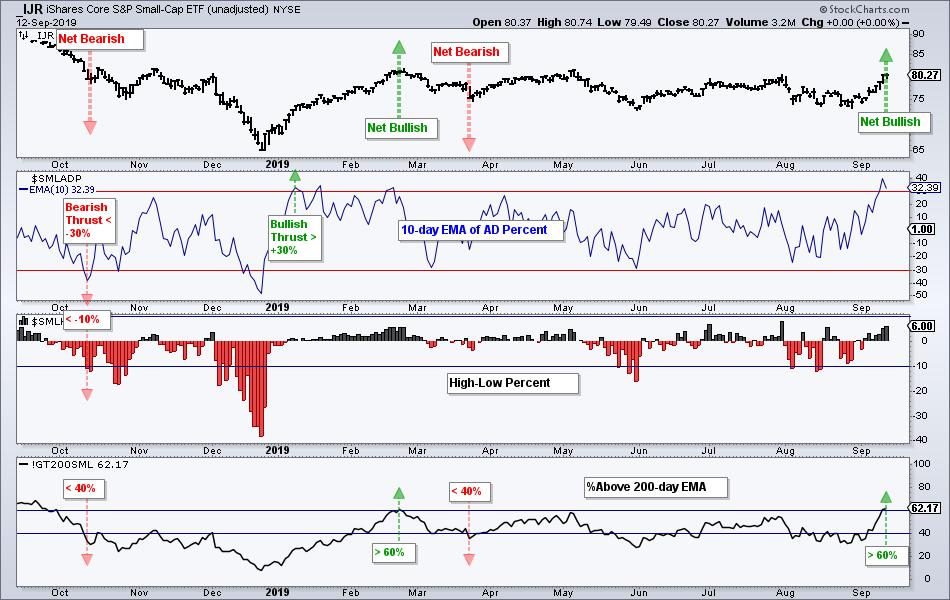
The Mid-Cap %Above 200-day EMA (!GT200MID) and the Small-Cap %Above 200-day EMA (!GT200SML) moved above 60% to turn bullish. The 10-day EMAs of S&P MidCap AD Percent ($MIDADP) and S&P SmallCap AD Percent ($SMLADP) were already bullish so two of the three indicators are now on active bullish signals for these two indexes (net bullish). The High-Low Percent indicators have yet to exceed +10% and reverse their bearish signals from October 2018.
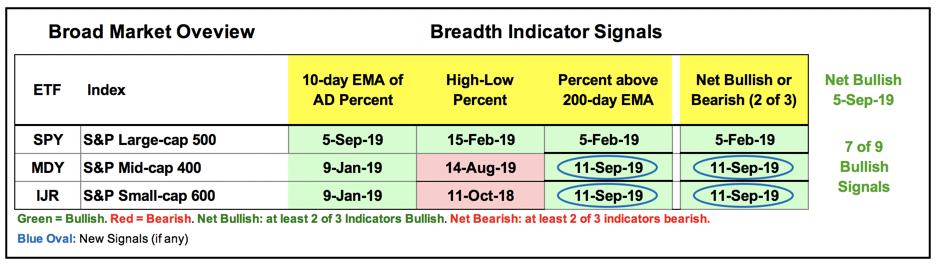
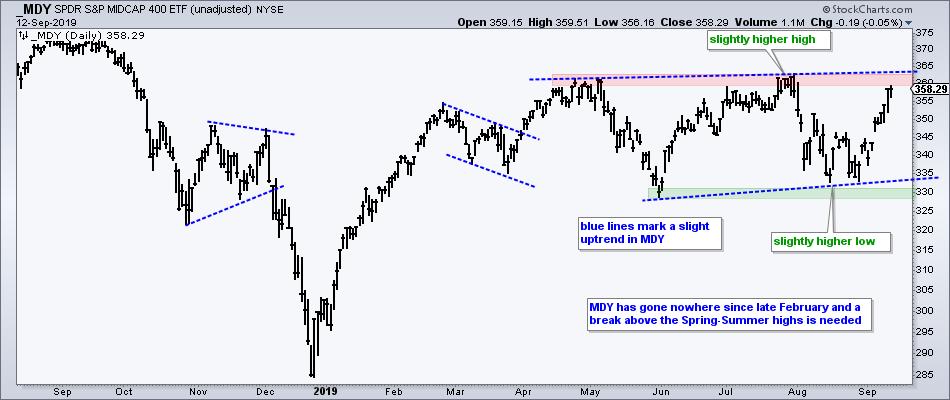
The table below shows the Index Breadth Model with seven of the nine indicators on bullish signals. High-Low Percent typically lags the other two indicators, which means we need to see some good upside follow through to generate new highs. Separately, note that the S&P SmallCap iShares, Russell 2000 iShares and S&P MidCap SPDR have yet to break above their July highs. Thus, we have yet to see confirmation on the price charts. The breadth improvement is positive for the broader market environment and now we need to see some price breakouts.
------------------------------------------------------------
Forget about Resistance for SPY
I do not consider the July high as a resistance level for the S&P 500 SPDR (SPY), but it is for the Russell 2000 iShares (IWM). How can that be? First and foremost, SPY is in a long-term uptrend. The ETF hit a new high in July, did not break the 200-day SMA during the August decline and held above its early June low in August. There is nothing on this chart to suggest a downtrend.
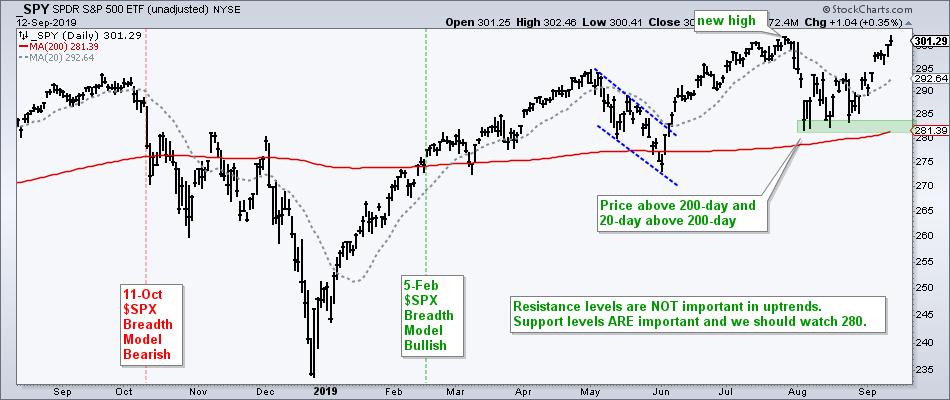
If we assume that SPY is in a long-term uptrend, then we should also assume that the path of least resistance is up. After all, a trend in motion stays in motion. After a higher low from early June to early August, SPY advanced back to its July high and even hit a new intraday high. I do not consider this prior high as a resistance level because price is clearly trending higher. Higher highs are expected in an uptrend so we should not focus on resistance levels. Instead, we should focus on support because it holds the key to the uptrend and a support break would argue for a trend reversal.
------------------------------------------------------------
IWM Challenges Resistance
In contrast to SPY, the Russell 2000 iShares (IWM) is in a long-term downtrend. The ETF hit a new low in December, did not come close to its 52-week high after the January-April surge and then formed lower highs and lower lows from May to September. A downtrend implies that lower lows and lower highs are the norm, and support levels are NOT expected to hold. Resistance levels, on the other hand, are important and we should watch them closely.
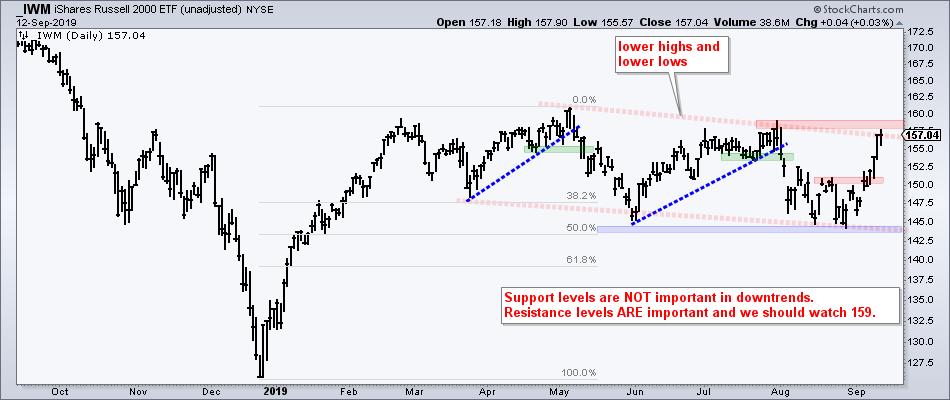
Despite a downtrend in IWM, signs of life are emerging as the ETF surged off the 50% retracement and challenged the July high, which is a robust resistance level. First, a "normal" correction retraces 1/3 to 2/3 of the prior advance with 50% acting as the base case. Think two steps forward and one step backward. The surge off this zone and the short-term breakout are positive, but not enough to reverse the series of lower lows and lower high. Look for a break above the July high to forge a higher high and provide the first sign of a meaningful trend reversal.
------------------------------------------------------------
Choose a Strategy, Develop a Plan and Follow a Process
Arthur Hill, CMT
Chief Technical Strategist, TrendInvestorPro.com
Author, Define the Trend and Trade the Trend
Want to stay up to date with Arthur's latest market insights?
– Follow @ArthurHill on Twitter


