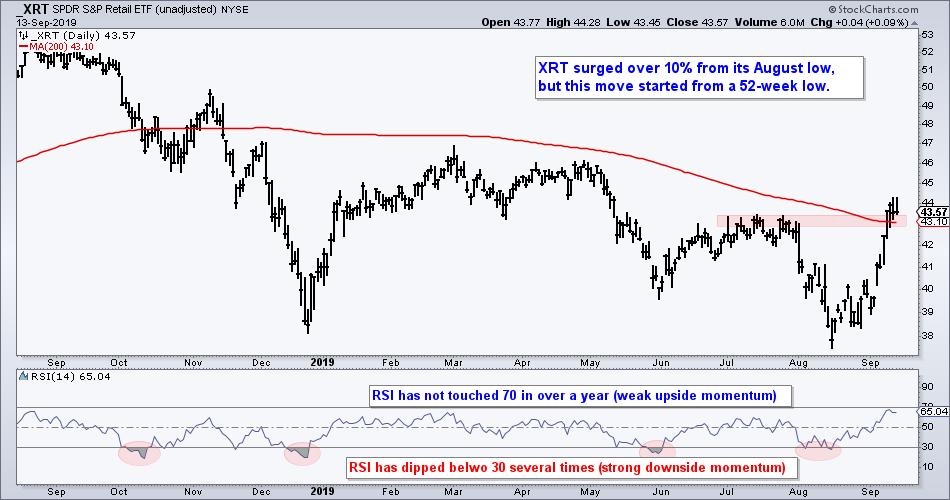
 There are still plenty of strong uptrends out there in ETF land, but we are seeing a bit of rotation in the stock market. The Utilities SPDR (XLU), Real Estate SPDR (XLRE) and Consumer Staples SPDR (XLP) remain in uptrends, but they corrected the last six days as some out of favor groups surged. The Oil & Gas Equip & Services SPDR (XES), Copper Miners ETF (COPX), Retail SPDR (XRT) and Metals & Mining SPDR (XME) are all up over 10% the last 13 trading days. These are impressive moves, but these ETFs are still in downtrends overall. The chart below shows XRT breaking above its July highs and falling 200-day SMA. While impressive, this move started from a 52-week low and I would not be chasing right now.
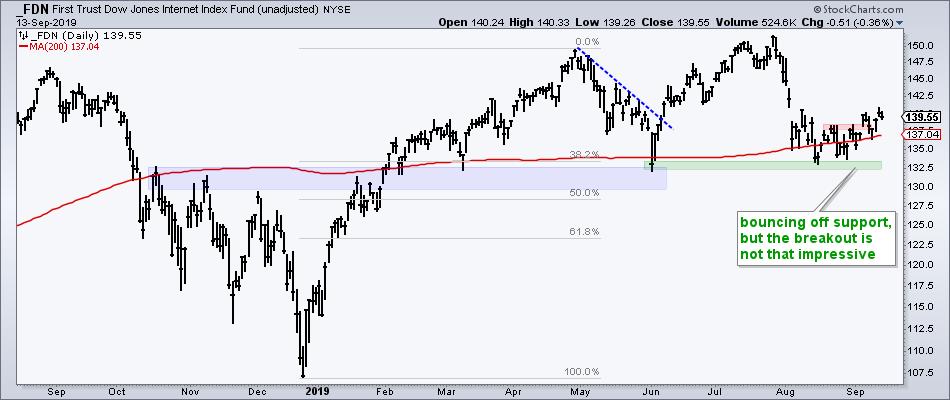
Some of the previous leaders seriously lagged over the last 13 days. The Internet ETF (FDN) is up just 2.6%, while the Mobile Payments ETF (IPAY), Software iShares (IGV) and Solar Energy ETF (TAN) are down over this period. They did not partake in the September surge. The chart below shows FDN hitting support from the early June low and breaking above its mid August high, but the breakout advance is not very impressive. FDN is suddenly a laggard. A move back below the rising 200-day would be negative.
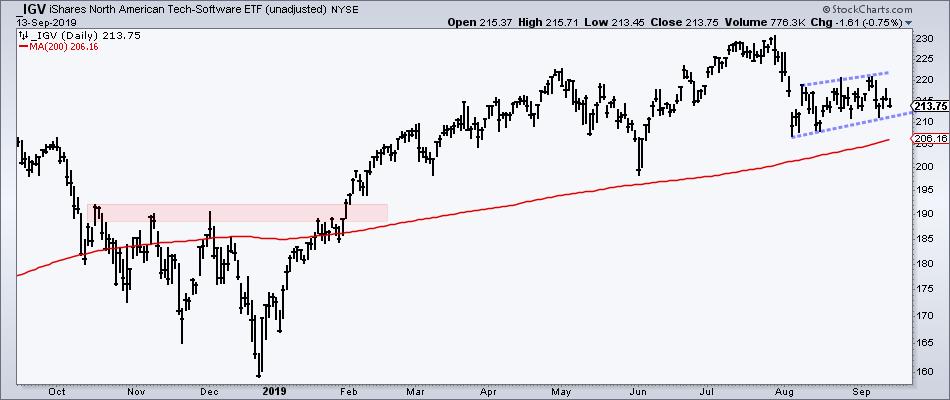
The next chart shows the Software iShares (IGV) with a slight rise from early August to early September. IGV is down 1% over the last 13 days, while SPY is up 5.8%. This bounce also pales relative to the surges seen in the lagging ETFs. IGV was a leader and is now showing weakness. A rising flag, which is a bearish continuation pattern, is taking shape and a break below the early September low would be negative.
I am also seeing relative weakness in the Fintech Thematic ETF (FINX), Cyber Security ETF (HACK), Cybersecurity ETF (CIBR), Cloud Computing ETF (SKYY) and Mobile Payments ETF (IPAY).
Even though semis are performing well, weak bounces in several tech-related ETFs should be a concern for the Technology sector. Keep in mind that the Technology accounts for 22% of the S&P 500 and is still the largest sector by far.
------------------------------------------------------------
Large-caps are Lagging
There are two sides to relative strength. One name is stronger than the other and one name is weaker than the other. Small-caps led the market higher as IWM surged 4.3% last week and SPY advanced 1.2%. Common knowledge suggests that relative strength in small-caps is bullish for the market. I beg to differ.
Yeah yeah, I know that small-caps represent the riskier end of the market and relative strength shows a resurgence in animal spirits. However, the S&P 500 SPDR performed just fine when the Russell 2000 iShares lagged, which it has been doing since July 2018. Note that SPY is up around 14% the last 18 months and the IWM is basically flat.
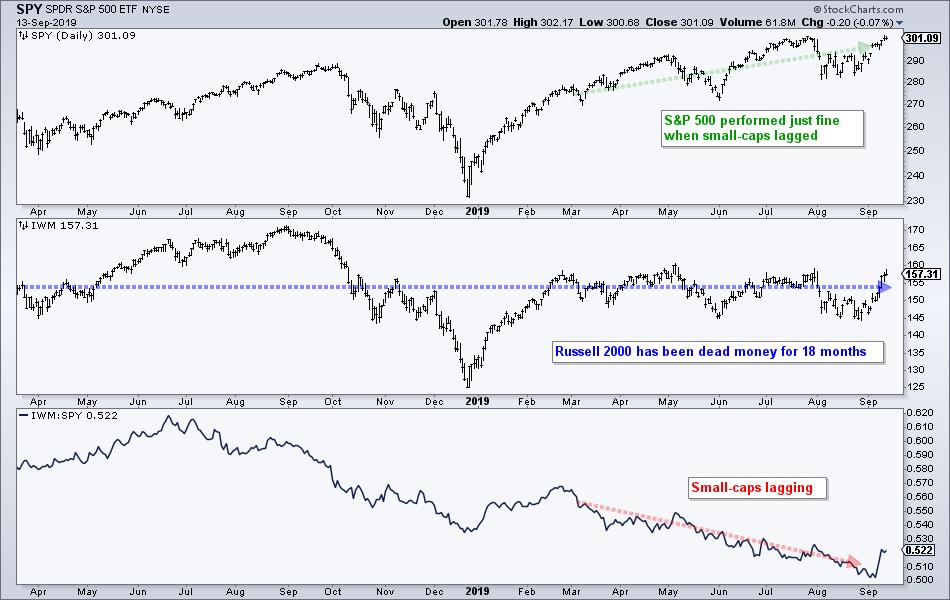
Relative strength in small-caps implies relative weakness in large-caps. I am more concerned when large-caps lag because the S&P 500 accounts for some 80% of the total US stock market. We should become concerned when the 800 pound gorilla in the room is lagging and the 80 pound chimp leading. IWM has led for a whopping 5 days, which is when the IWM:SPY ratio turned up. IWM is still lagging on the three, six, nine and twelve month timeframes.
Relative performance is not a consideration for my broad market assessment. I prefer to focus on absolute performance and absolute trends. IWM is flat at best. SPY, on the other hand, is still in an uptrend and near an all time high. As noted in Thursday's commentary, which includes an update to the Index Breadth Model, the August lows hold the key for SPY and the broader market.
------------------------------------------------------------
Strong Uptrends
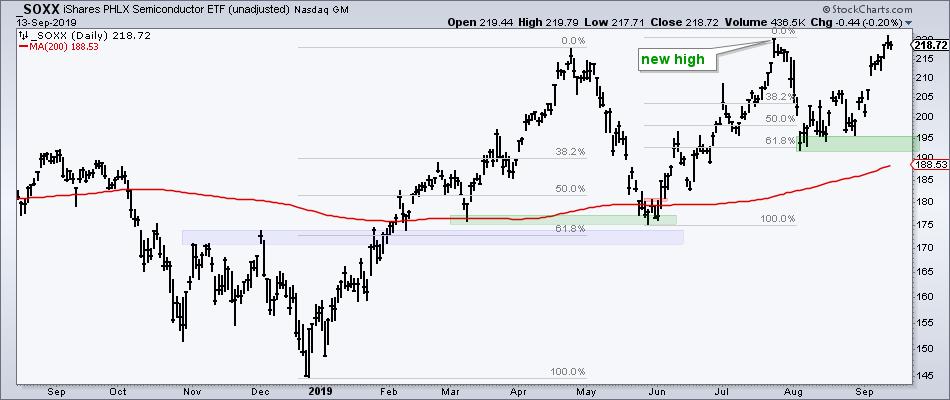
In contrast to FDN and IGV above, the Semiconductor iShares (SOXX) surged off the August lows with an impressive bounce the last 13 days (195 to 220). The chart below shows SOXX firming near the 62% retracement in early August and surging back to its July high. This is NOT resistance because the bigger trend is up and higher highs are expected in an uptrend. The August lows mark key support to watch going forward.
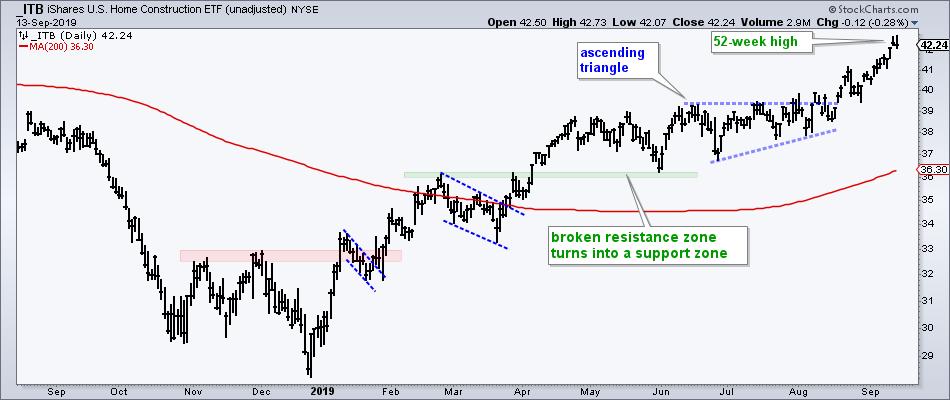
The Home Construction iShares (ITB) also impressed with an ascending triangle breakout in mid August and a move to new highs over the last few weeks. ITB is not leading in percentage terms over the last 13 days, but it is up 10% over the last four weeks and in a strong uptrend.
Other names in strong uptrends include: Minimum Volatility iShares (USMV), Utilities SPDR (XLU), Real Estate SPDR (XLRE), Consumer Staples SPDR (XLP), Home Builders SPDR (XHB), Aerospace & Defense iShares (ITA), Solar ETF (TAN), Insurance ETF (KIE) and Medical Devices ETF (IHI).
------------------------------------------------------------
Uptrends and Strong Bounces (XLI, XLF)
The Financials SPDR (XLF) held the June low and broke short-term resistance with a gap on September 5th. This gap held and we saw strong follow through, which is bullish.
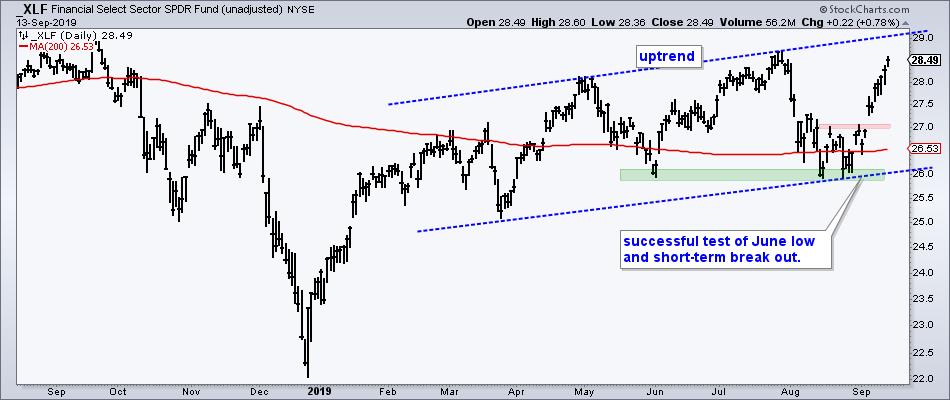
Overall, I can see a rising channel of sorts to define the uptrend since February. There are higher lows from March to August, and higher highs from May to July. The next target is in the 29-30 area.
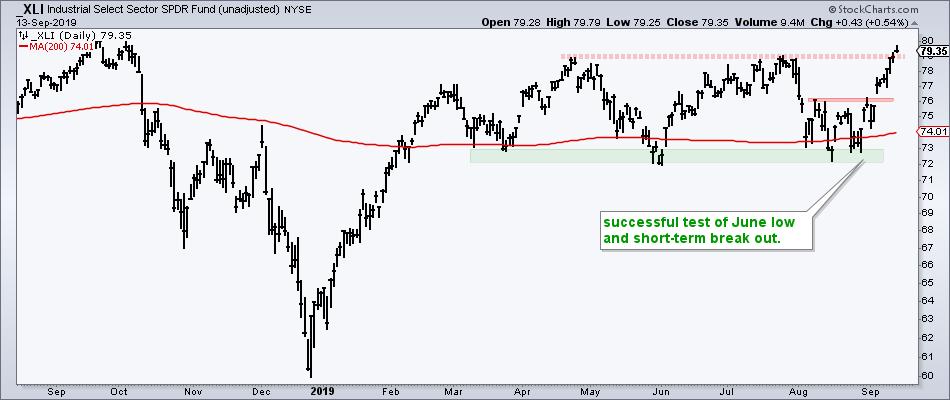
The Industrials SPDR (XLI) also successfully tested support from the May-June lows and broke short-term resistance with a gap-laden surge in early September. The ETF also followed through with a break above the spring-summer highs.
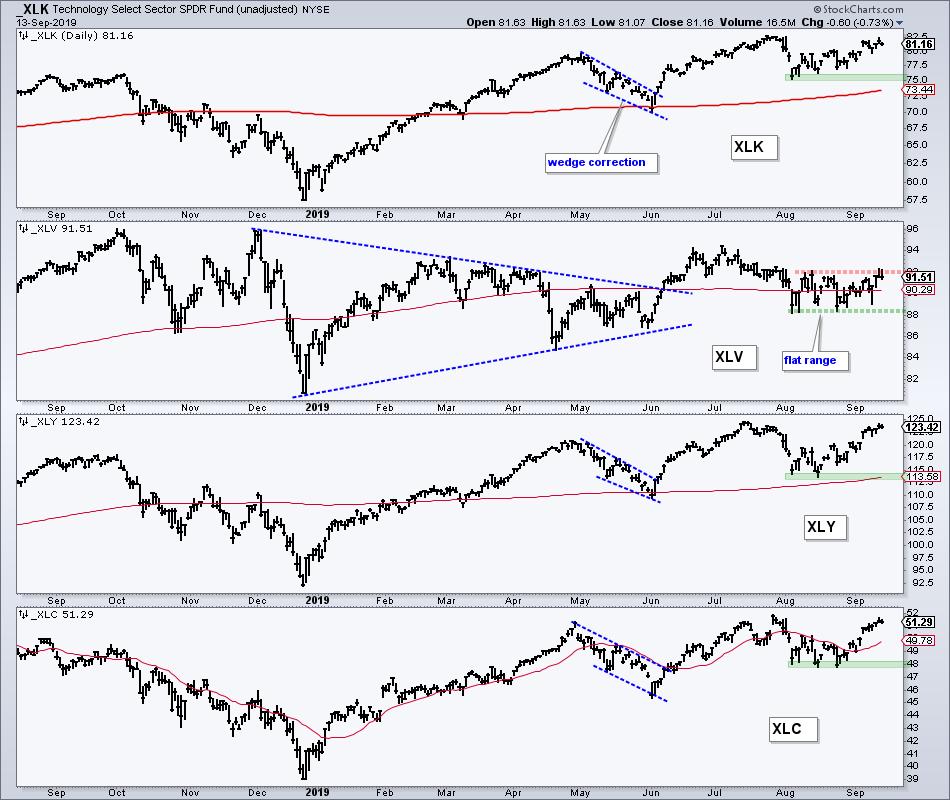
The Technology SPDR (XLK), Communication Services SPDR (XLC) and Consumer Discretionary SPDR (XLY) are back near their summer highs and still in uptrends. The August lows now mark key support going forward. It looks like XLI and XLF are taking the lead with strong moves the last 13 days. The Health Care SPDR (XLV) remains in a funk because it did not break above its mid August highs. XLV is by far the unhealthiest of the six biggest sectors.
------------------------------------------------------------
TLT and GLD Start Correcting
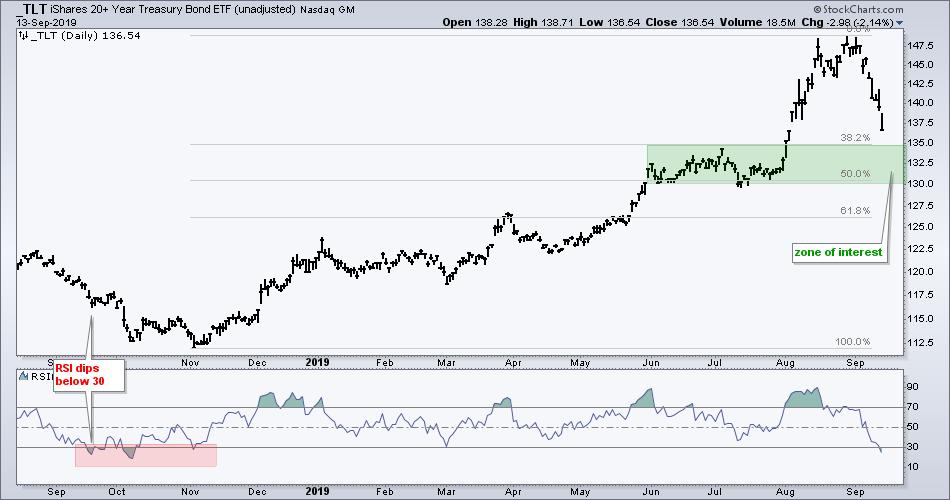
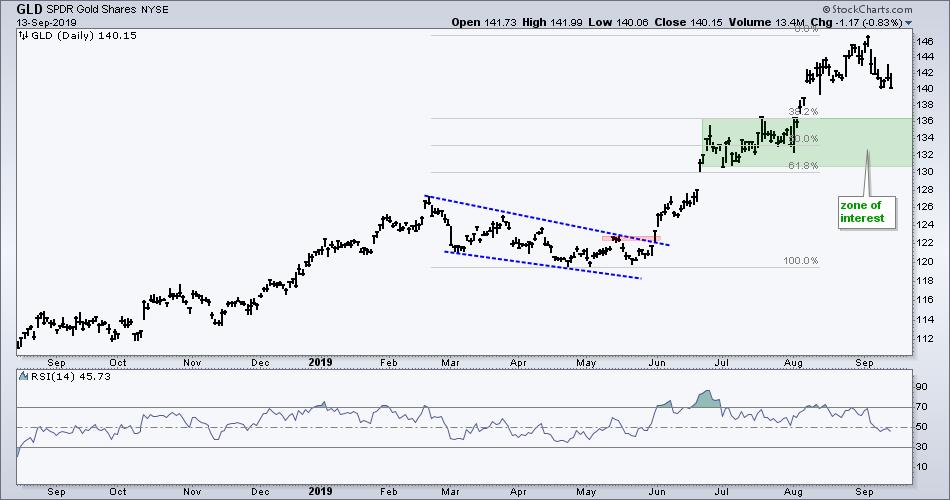
The Gold SPDR (_GLD) and the 20+ YR T-Bond ETF (_TLT) are in correction mode after becoming extremely overbought. These two were highlighted on August 29th after the weekly PPO(1,40,0) exceeded +10%. TLT is down around 7% from its recent high and GLD is down around 4%. These are still in long-term uptrends, but corrections are underway and I think a little patience is needed to wait for a decent setup. In other words, they have yet to reach "interesting" levels with "interesting" patterns.
The chart below shows the zone of interest for TLT in the 130-135 area. Yes, I realize it is a big zone, but TLT is falling hard and may need some time to stabilize. RSI(10) moved below 30 for the first time since early November. Notice how RSI dipped below 30 in September and the ETF then took around seven weeks to stabilize.
The next chart shows GLD with a zone of interest in the 131-136 area. A decline into this area would retrace 38-62 percent of the prior advance and take GLD back to the July consolidation. I am also prepared to wait for this correction to take its course because I do not see a clear bullish continuation pattern yet, such as a falling wedge of flag.
------------------------------------------------------------
Tempting, but Certainly Not Leading (XBI, IBB)
There is a group of ETFs that look tempting on the price charts, but they are NOT in uptrends and they are certainly NOT leading. This is where strategy and plan come into play. Even though these charts are possibly interesting for bottom pickers, they would not fit in a trend-following or relative strength strategy. You need to have a strategy and a plan. Personally, I consider these higher risk plays simply because they are not leading and are not in uptrends. I am not a bottom picker and I prefer to avoid the laggards, even if I am late to the party when they finally start leading.
I would place the Biotech iShares (IBB) and Biotech SPDR (XBI) into the bottom picking category, and possibly the Regional Bank SPDR (KRE) and Bank SPDR (KBE). They are in a sort of no-man's land and need to prove themselves before earning a spot on my bullish radar.
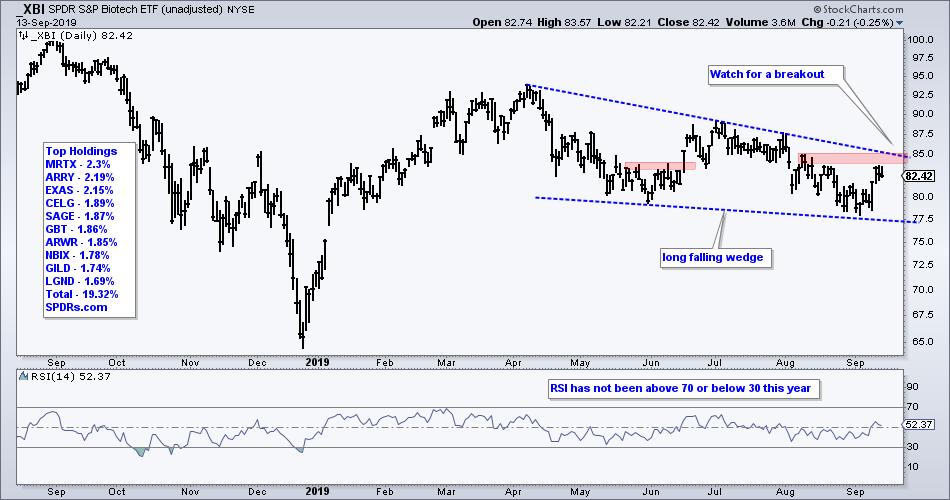
The charts below show IBB and XBI going nowhere since mid January and trading closer to their spring lows than their summer highs. Momentum is lacking in both directions because RSI(14) has not been above 70 or below 30 in 2019. These two are exceptionally boring, especially for biotechs.
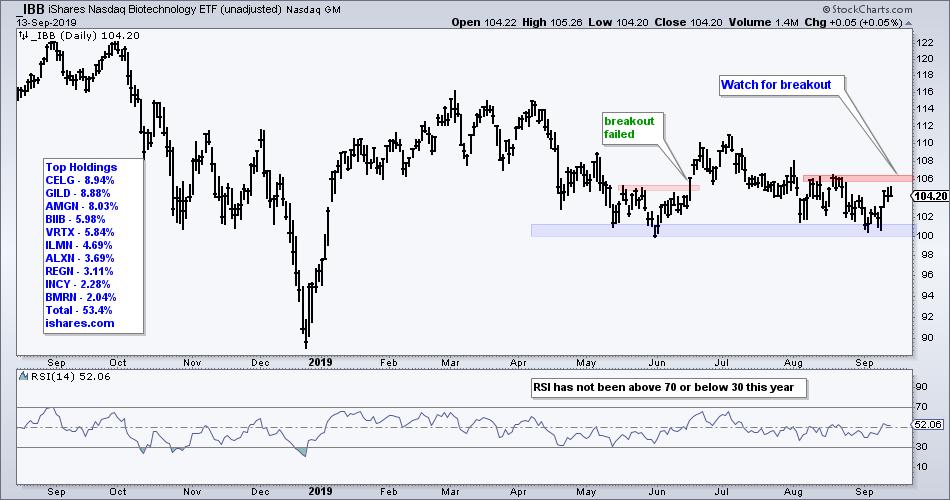
Boring may be good, but I will wait for the breakout. IBB is firming in the 100-101 area and attempting a bounce, while XBI has a large falling wedge working over the last five months. The onus is currently on the bulls to prove the bears otherwise. Both need to break their August highs (red zone) to signal a notable increase in buying pressure that could lead to a bigger trend reversal.
------------------------------------------------------------
Choose a Strategy, Develop a Plan and Follow a Process
Arthur Hill, CMT
Chief Technical Strategist, TrendInvestorPro.com
Author, Define the Trend and Trade the Trend
Want to stay up to date with Arthur's latest market insights?
– Follow @ArthurHill on Twitter


