It was a big week for stocks and the breadth indicators backed up the bullish price action. The S&P 500 SPDR (SPY) broke out of its August range to signal a continuation of the bigger uptrend. Even though the Index Breadth Model turned bearish in mid August, the S&P 500 indicators remained net bullish and ultimately overruled the bearish signals from small-caps and mid-caps (more on that later).
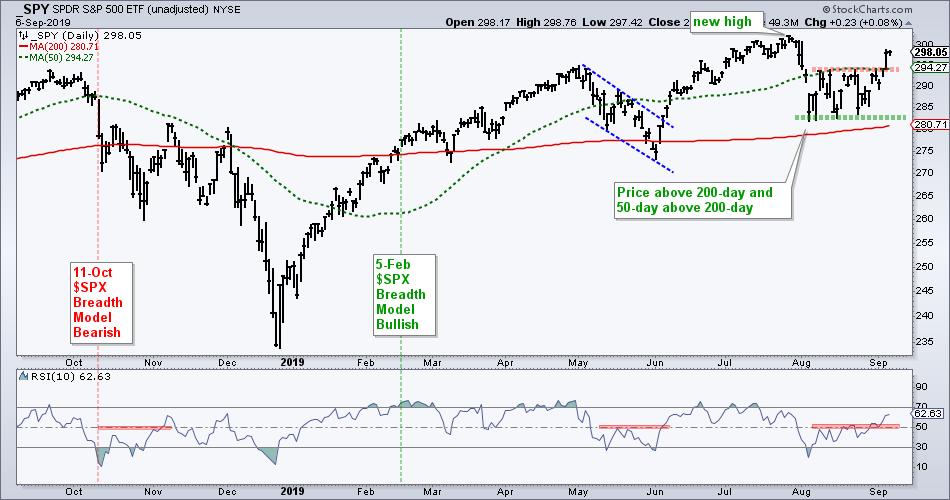
So we have the range breakout heard 'round the world. At this point we must take it for what it is: bullish until proven otherwise. This breakout represents follow through to the surge on August 29th and suggests that new buyers are entering the market. Follow through was lacking during the range and this week's follow through was impressive. Moreover, this move reinforces support from the August lows and the rising 200-day SMA.
------------------------------------------------------------
Index Breadth Model Flips
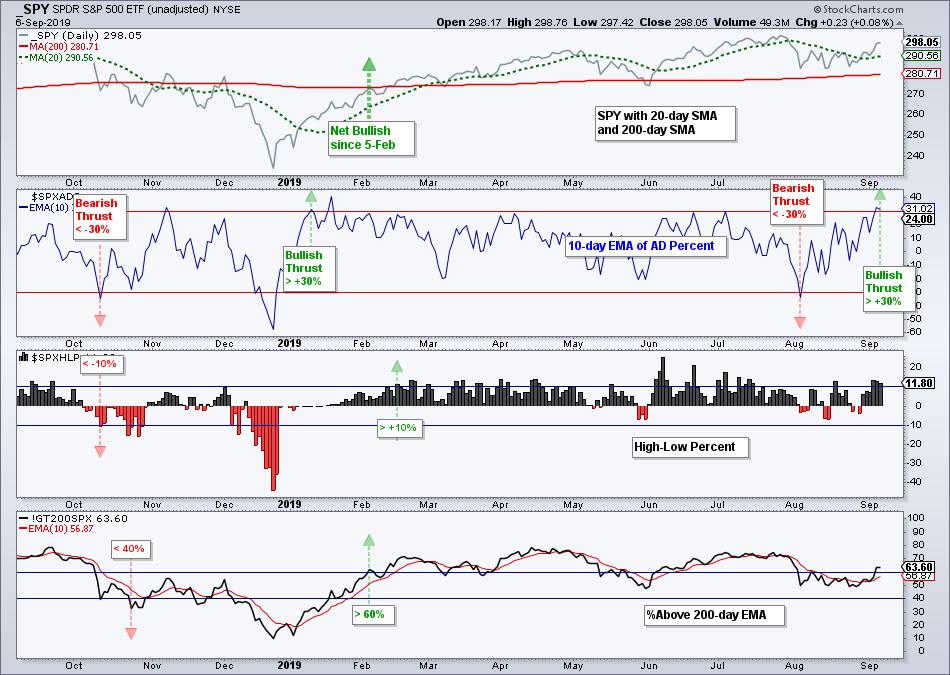
The Index Breadth Model moved from net bearish to net bullish as the 10-day EMA of S&P 500 AD Percent ($SPXADP) surged above +30% and reversed its bearish signal. As the chart above shows, the S&P 500 breadth indicators have been net bullish since February 5th and the S&P 500 has been the strongest of the three indexes.
Overall, five of nine signals were bearish at the start of the week, but now five of nine are bullish. It is not hard to flip the model when it stands at 5. All it takes is one signal. As with the bearish period, this new bullish signal is not overwhelming because four indicators are still on active bearish signals. Mid-caps and small-caps are still not taking part and large-caps are the place to be.
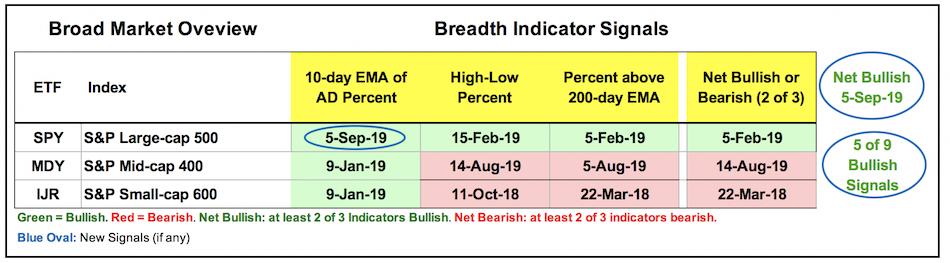
The S&P 500 is the 800-pound gorilla in the stock market and all three of its indicators are on bullish signals. Remember, the S&P 500 accounts for some 80% of the total US stock market. This behemoth has been net bullish since February 5th. On the other side, the S&P Small-Cap 600 has been net bearish since March and remains bearish.
What are we to make of this flip? I think we need to treat these indexes as separate entities and put more weight on the S&P 500. While I am trying for a broad market assessment with the Index Breadth Model, it is clear that there are three separate entities at work (large-caps, mid-caps and small-caps). Large-caps are the place to be, small-caps are the place to avoid and mid-caps are stuck somewhere in between.
------------------------------------------------------------
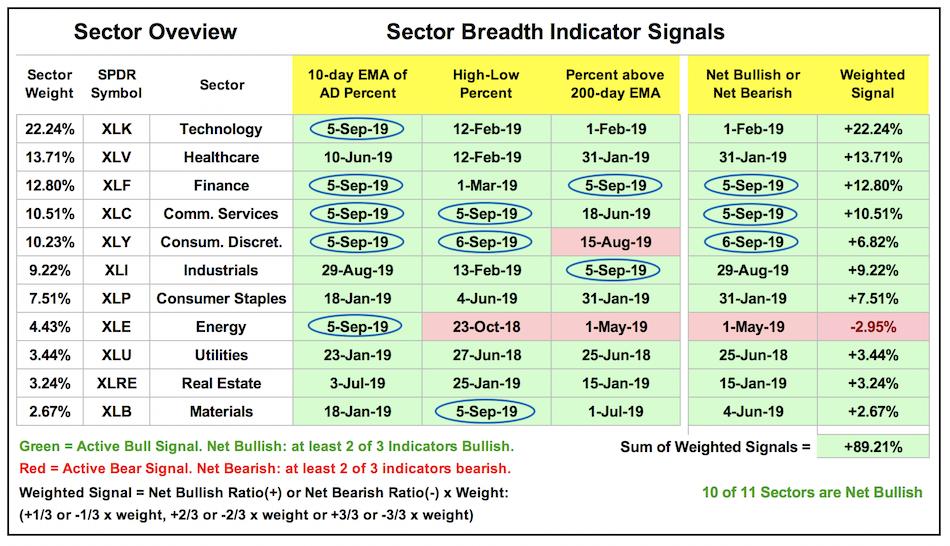
Big Improvement for Sector Breadth Model
Unsurprisingly, the Sector Breadth Model also improved with several new signals. Breadth thrusts in Technology, Finance, Communication Services, Consumer Discretionary and Energy powered the S&P 500 breadth thrust. We also saw new highs expand in the Communication Services and Consumer Discretionary, and the %Above 200-day EMA trigger bullish for Finance and Industrials.
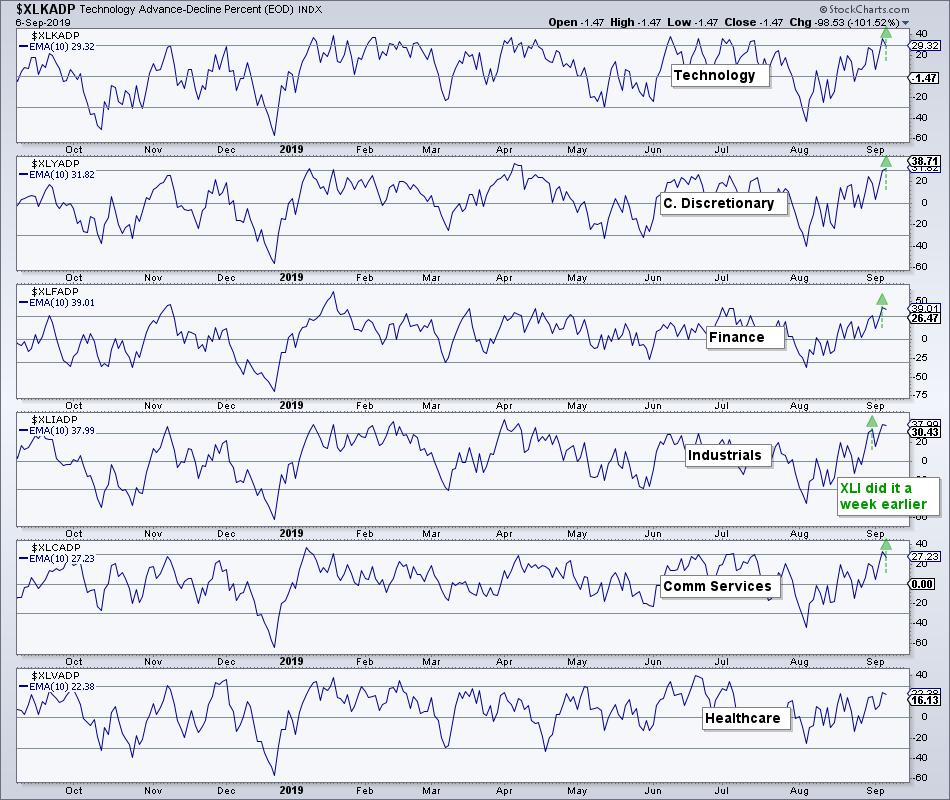
What a difference a month makes. Finance, Consumer Discretionary and Communication Services were net bearish in mid August, but have since flipped back to bullish. Industrials flipped back to bullish last week, while Technology and Healthcare were already bullish. This means the big six are net bullish and this is bullish for the S&P 500. The Consumer Discretionary remains net bearish with two of three signals bearish. However, XLY High-Low% ($XLYHLP) is very close to exceeding +10% and Discretionary %Above 200-day EMA (!GT200XLY) is very close to exceeding 60%.
Is this a whipsaw or the start of an extended uptrend? First, whipaws are part of the investing process and unavoidable. We never know which signals will result in whipsaws and which will herald an extended trend. Second, I do not consider this a whipsaw because the S&P 500 remained bullish throughout. Small-caps were already bearish and remained bearish.
------------------------------------------------------------
This Week on Art's Charts
Four Keys to Finding Meaningful Bullish Reversal Patterns - with Two Live Examples (Saturday - click here)
SOXX extends bounce off key retracement, IPAY holds up well and ranking ETFs by chart performance (Thursday - click here)
Charting and analyzing the AD Lines, Up/Down Volume Lines and High-Low Lines for the S&P 500, S&P Mid-Cap 400 and S&P Small-Cap 600 (Thursday - click here)
Trading range extends, large-cap breadth holds up, low volatility leads high beta and junk bonds show little fear (Wednesday - click here)
A classic reversal pattern in a digital storage leader - Plus four other setups (Wednesday - Click here)
QQQ and SPY are doing just fine as XLY and XLK carry the load in August (Tuesday - click here)
-----------------------------------------------------------
Choose a Strategy, Develop a Plan and Follow a Process
Arthur Hill, CMT
Chief Technical Strategist, TrendInvestorPro.com
Author, Define the Trend and Trade the Trend
Want to stay up to date with Arthur's latest market insights?
– Follow @ArthurHill on Twitter


