
After studying the charts in my core ETF list, I came up with eight groupings. The top three groups represent ETFs that are still in uptrends, while the bottom three groups represent ETFs that are in downtrends and lagging overall. The middle groups are in flux. Group 4 represents ETFs that corrected hard after becoming extremely overbought (GLD, TLT), while group 5 represents ETFs that are on the verge of a trend change (IWM, IJR, KRE).
Group 3 and 6 are perhaps the most interesting from a trading standpoint right now. By interesting, I mean they are setting up for a possible move higher. The tech-related ETFs in group 3 are still in uptrends and firming near support levels. The biotech ETFs in group 6 are firming near their spring lows and they are on breakout watch, while XME has a potential double bottom.
The three defensive sectors remain in the top group, along with housing, defense, insurance and medical devices ETFs. Even though SPY, QQQ and XLK are still in uptrends, they did not record new highs in September and slipped from the top group. This is not bearish and could change with strength today. Below is an overview of the grouping and symbols.
1) Strong uptrends with new highs in September (USMV, MTUM, XLU, XLP, XLRE, ITA, ITB, XHB, IYR, KIE, IHI, VIG)
2) Uptrends and close to new highs (SPY, QQQ, XLK, SOXX, TAN, HYG)
3) Uptrends, but did not bounce after August correction (moment-of-truth?) (IPAY, IGV, SKYY, HACK, FINX, FDN)
4) Oversold in uptrend (poised to bounce?) (AGG, TLT, TIP, MUB, GLD, SLV)
5) Downtrends, but challenging resistance (breakouts pending?) (MDY, IJR, IWM, KRE, KBE)
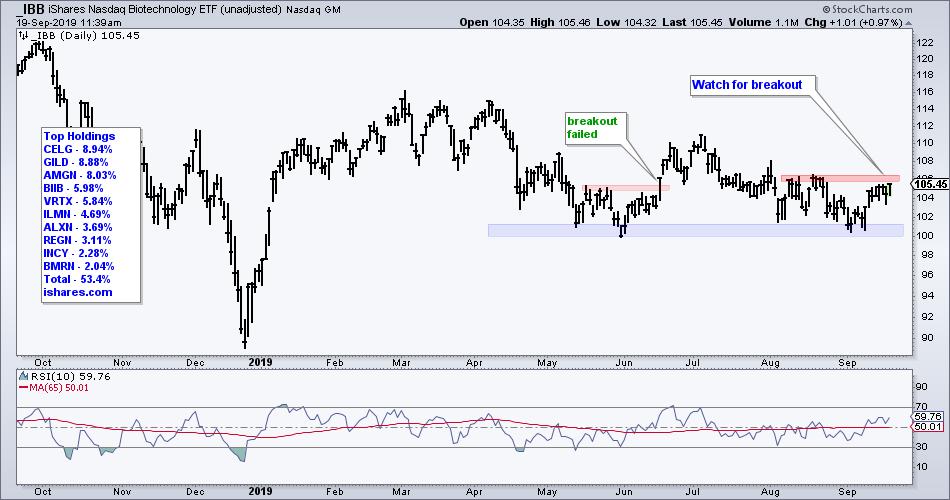
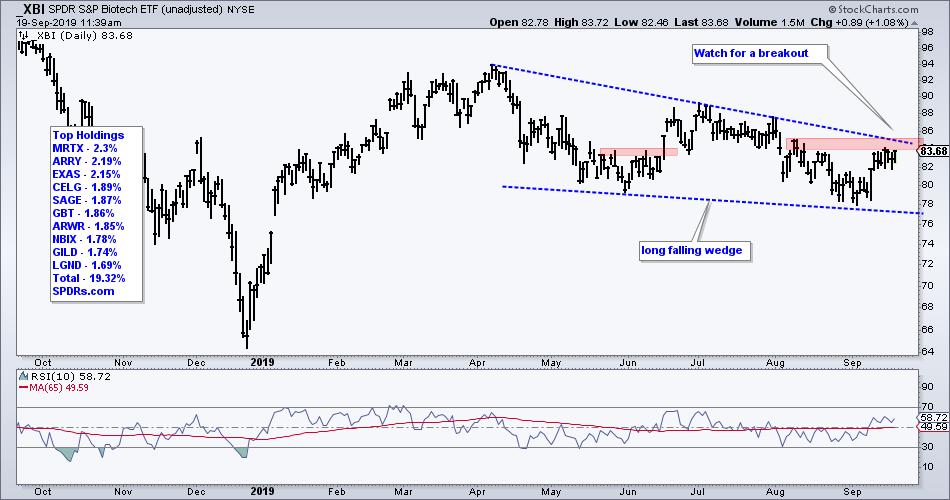
6) Downtrends, but firming near prior lows (watch for breakout) (XBI, IBB, XME)
7) Oversold bounces within downtrends (not interested) (XLE, XRT, REM, XES, FCG, XOP, AMLP, REMX, DBC)
8) Downtrends (definitely not interested) (IHF, MJ)
Note that all symbols are preceded with an underscore (_) on the charts to show unadjusted data. This means the dividends were NOT added back to the price and we are seeing a pure supply-demand picture. This makes support and resistance levels more robust. Adding the dividends back to the price series create an artificial price gain that gives the price charts an upward bias.
------------------------------------------------------------
New Highs and Clear Leaders
This first group covers ETFs that are in the strongest uptrends right now. They are above their 200-day SMAs, RSI is in bull mode and they hit new highs in September. Group 1 Symbols: USMV, MTUM, XLU, XLP, ITA, ITB, XHB, IYR, KIE, IHI, VIG.
The Momentum Factor iShares (MTUM) and Minimum Volatility iShares (USMV) hit new highs in September and MTUM is holding its own against USMV on the price chart. The death of momentum has been greatly exaggerated! The first chart shows MTUM with new highs beginning in June and extending into July and early September. The trend is clearly up with the August low marking support.
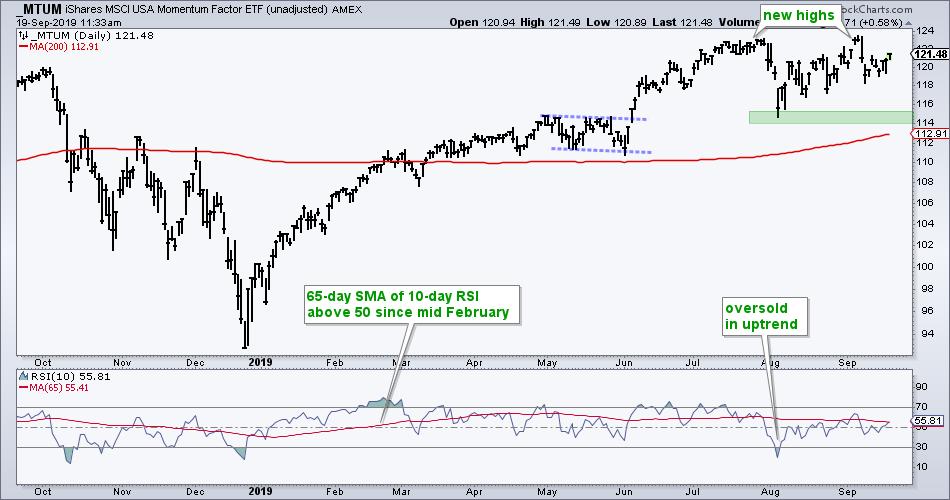
The indicator window shows RSI(10) with a 65-day SMA (red). Keep this indicator in mind because it is used on several charts below. This combination allows us to use RSI to define the trend and identify oversold conditions. The trend is up when the 65-day SMA is above 50, which has been the case since mid February. The ETF is short-term oversold when RSI(10) dips below 30, which occurred in early August. Oversold conditions and bullish continuation patterns are our friends when the bigger trend is up.
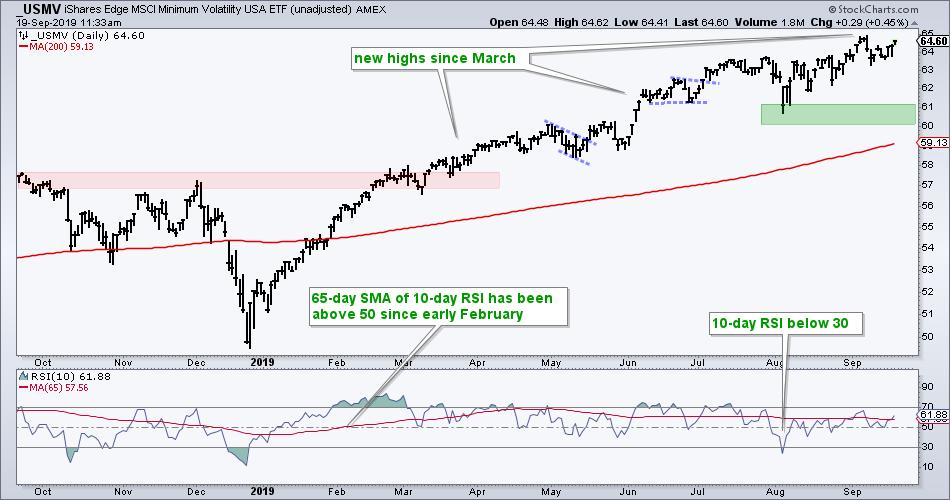
The next chart shows USMV with a parade of new highs since March, which is how long this ETF has been leading on the price chart. Note that MTUM hit its first new high in June, three months later. USMV remains in a strong uptrend with the August lows and a buffer marking support in the 60-61 area.
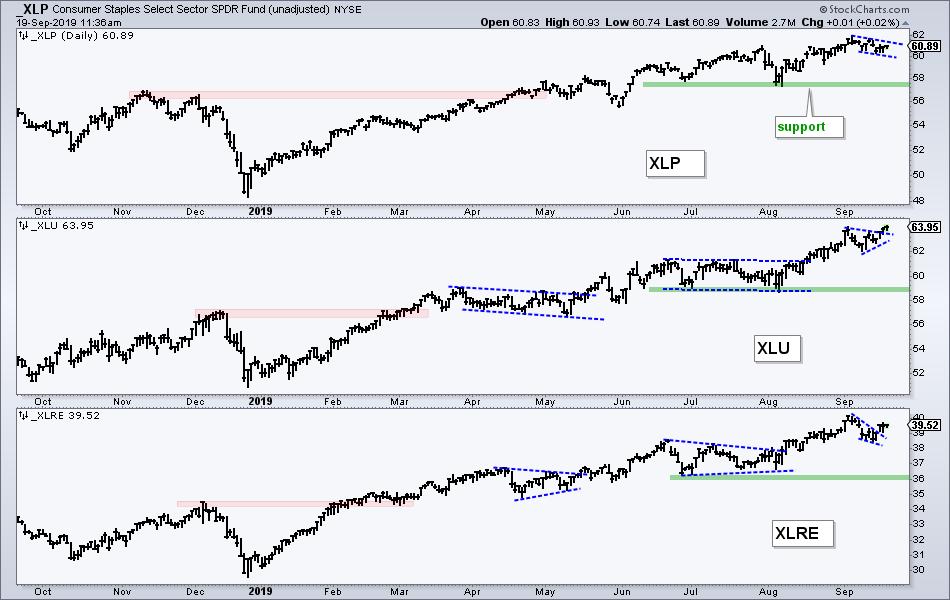
The Utilities SPDR (XLU), Consumer Staples SPDR (XLP) and Real Estate SPDR (XLRE) are the strongest sectors right now. All three hit new highs in early September and corrected with short pullbacks. XLP remains in a short pullback that looks like a falling flag. XLU broke out of a pennant pattern this week and is close to another new high. XLRE broke out of a small wedge over the last two days.
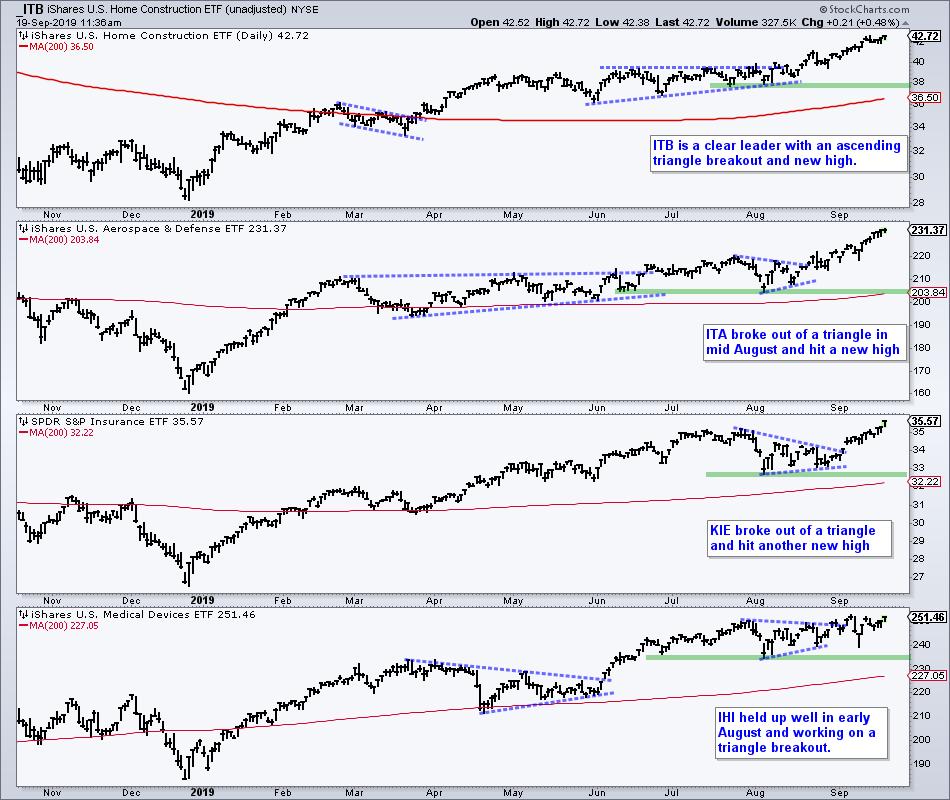
The Home Construction iShares (ITB), Aerospace & Defense iShares (ITA), Insurance SPDR (KIE) and Medical Devices ETF (IHI) also hit new highs in September. ITB and ITA are the strongest of the four with August breakout and a string of new highs.
------------------------------------------------------------
Uptrends and Near New Highs
Group 2 shows ETFs that are in uptrends and close to new highs. Some of these were in the leadership group in July, but they have yet to record new closing highs since July and fell out of the top tier. Nevertheless, these ETFs are still in uptrends and by no means weak. Group 2 symbols: SPY, QQQ, XLK, SOXX, TAN, HYG.
The first chart shows SPY breaking out of its August consolidation with a surge above 295 and challenging the July high. The August lows and rising 200-day SMA mark support in the 280-283 area. Note that S&P 500 breadth indicators have been net bullish since February 5th and the 65-day SMA of RSI(10) has been above 50 since mid February. Also notice that two of the three dips below 30 in RSI(10) provided great mean-reversion signals. The next chart shows QQQ with a similar picture.
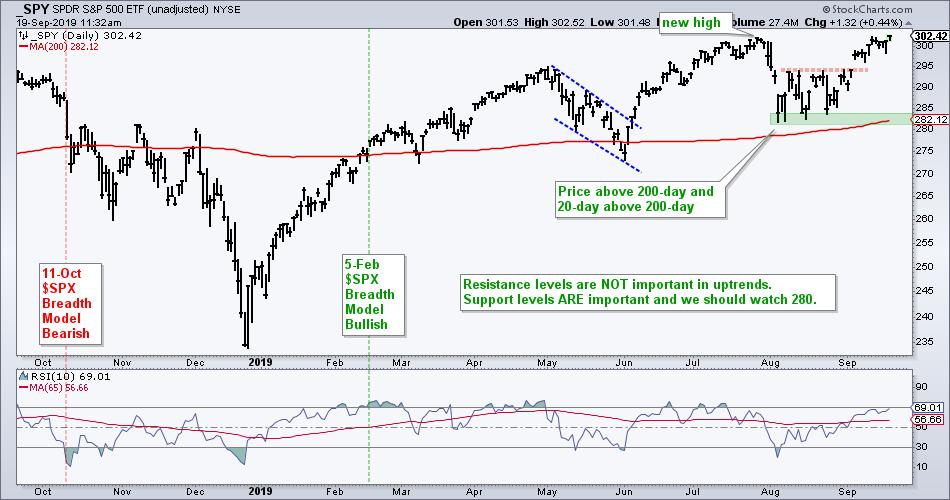
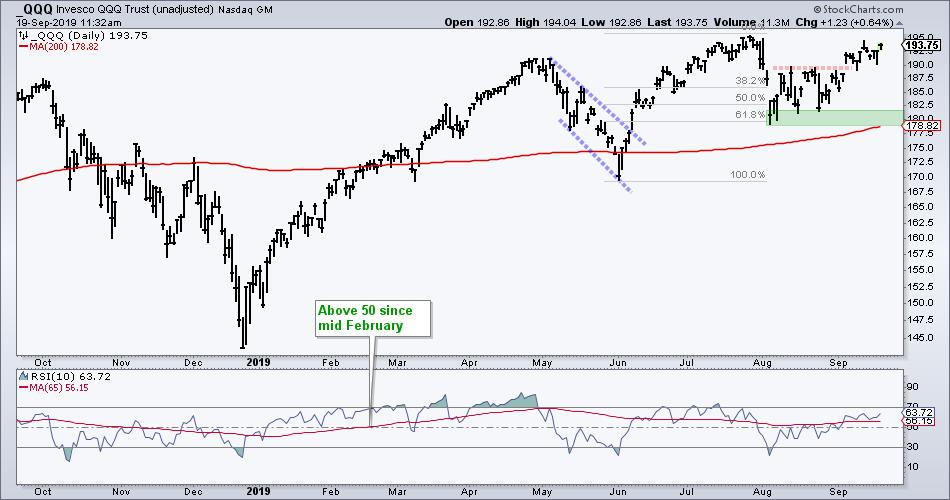
Overall, the stock market is in good shape when SPY and QQQ are in clear uptrends and within 1% of all time highs.
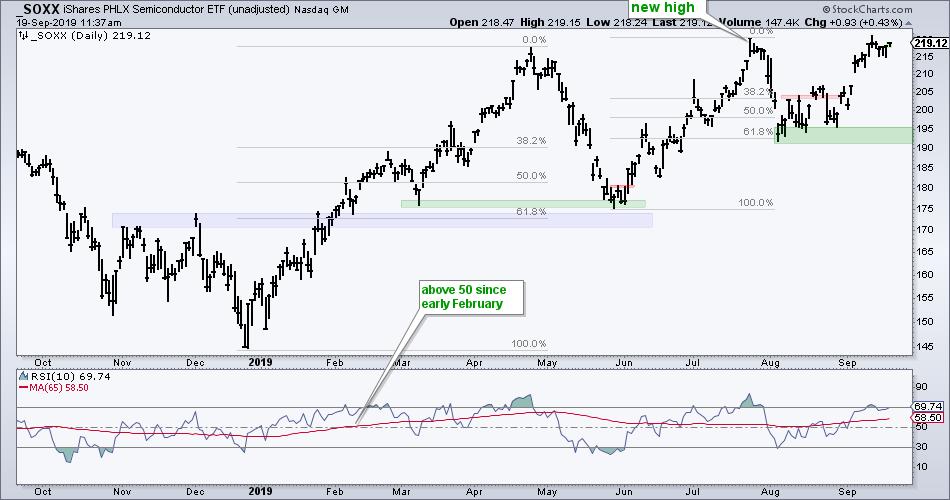
The Semiconductor iShares (SOXX) is the strongest of the tech-related ETFs because is surged back to the July high. The ETF record a new high intraday, but has yet to record a new closing high. Note that I do NOT consider the 220 area as resistance because the bigger trend is up. The 65-day SMA of RSI(10) has been above 50 since mid February. The August lows mark support in the 190-195 area.
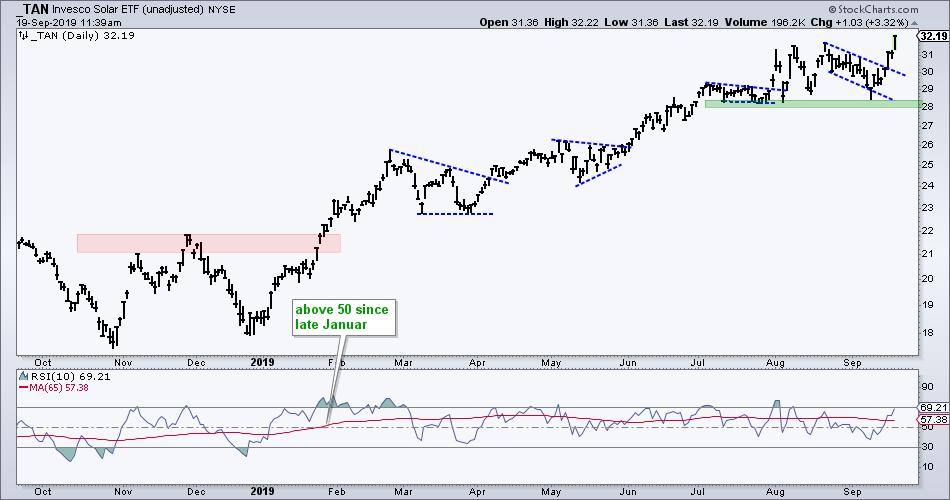
The Solar Energy ETF (TAN) stalled out a bit over the last five weeks, but caught a bid this week with a falling flag breakout. The July-September lows mark support in the 28 area. Note that the 65-day SMA of RSI(10) has been above 50 since late January. This means TAN was one of the first to break out this year and start leading the market. The 65-day SMA of RSI(10) moved above 50 in February for most other ETF leaders.
------------------------------------------------------------
At Moment-of-truth
Group 3 shows ETF in uptrends, but they did not bounce much after the August correction. Even though these weak bounces are a concern, the overall trends are still up and these ETFs are at a moment-of-truth. Either they continue their uptrends or the second shoe drops and they reverse their uptrends. This is an important group to watch because these are tech-related ETFs and their performance will affect the Technology sector, which is still the largest sector in the S&P 500. Group 3 symbols: IPAY, IGV, SKYY, HACK, FINX, FDN.
The first chart shows the Software iShares (IGV) hitting a new high in July, taking a hard hit in early August and edging higher the last five weeks. The cup is clearly half full as long as the short-term upswing holds. A close below 210 would be negative. Until such a break, I would expect IGV to continue its bigger uptrend because the bigger uptrend is still the dominant force at work here.
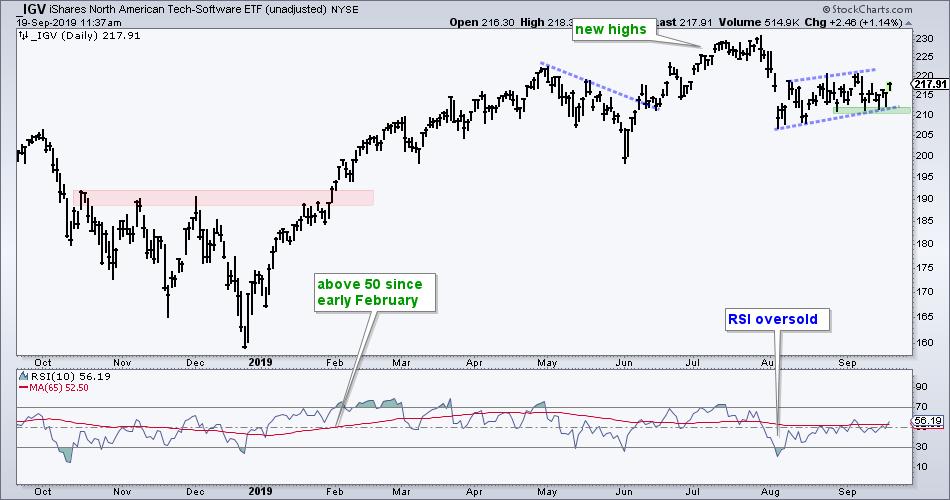
The indicator window shows the 65-day SMA of RSI(10) moving above 50 in early February and staying above 50. Watch for a move below 50 to signal a trend reversal. RSI(10) became oversold in early August and we are in the midst of an oversold bounce, however feeble it may look now.
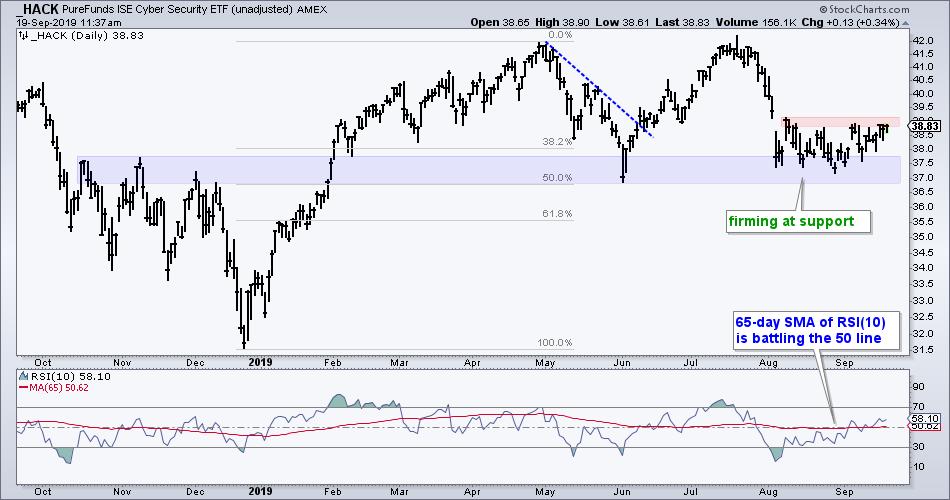
The next chart shows the Cyber Security ETF (HACK) falling to support in early August and firming the last five weeks. The 65-day SMA of RSI(10) is battling the 50 line as the ETF trades at its make-or-break level. A break above the red resistance zone keeps the bulls alive, while a break below the August low would be bearish.
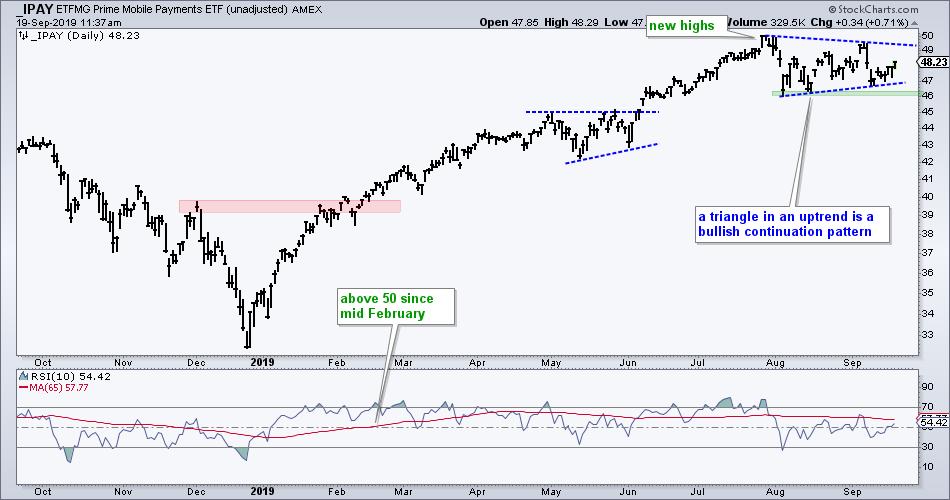
The Mobile Payments ETF (IPAY) is at an interesting juncture as it firms near the August lows and edges higher the last six days. An upturn within the triangle would increase the odds of a triangle breakout and new high.
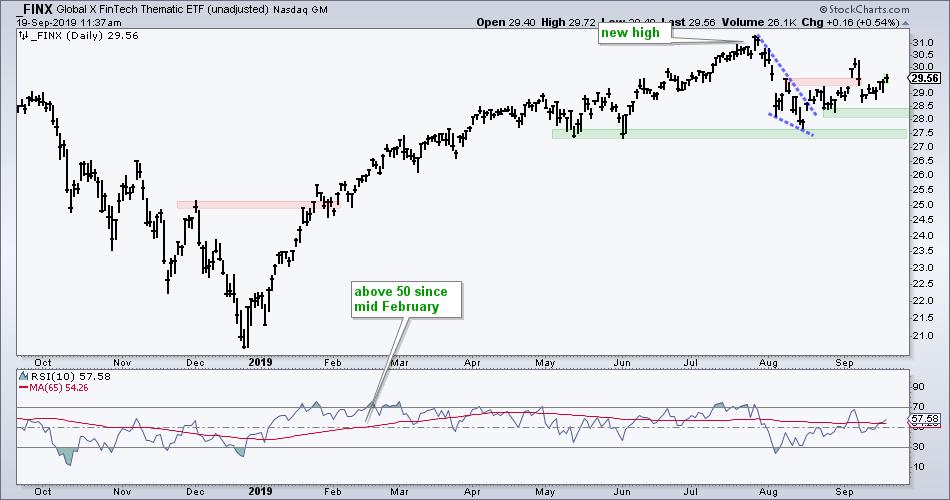
The Fintech Thematic ETF (FINX) broke out of a steep falling wedge in mid August and broke above the early August high in early September (red zone). Even though the ETF fell back right after this breakout, the trend since early August is up (and the long-term trend is up). A close below 28 would call for the first re-evaluation and a close below the May-August lows would reverse the uptrend.
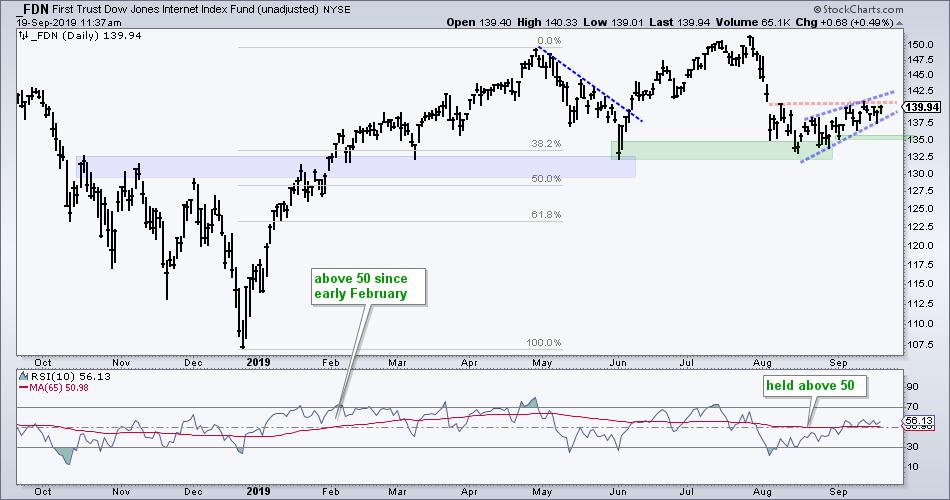
The Internet ETF (FDN) fell to support in early August and then edged higher the last three weeks. This may be a bearish rising wedge, but the bigger trend is still up and support from the early June low held. Even though I still consider the cup to be half full on this chart, I would watch the rising wedge closely. A close below the September low (135) would call for a re-evaluation.
------------------------------------------------------------
Challenging Resistance
I am skipping group 4 to focus on group 5, which shows ETFs that could reverse their downtrends. The Gold SPDR (GLD) and 20+ YR T-Bond ETF (TLT), which are in group 4, still need some time to settle before I would consider them "interesting". They are challenging resistance levels after strong advances in September and further strength would trigger a breakout. Group 5 symbols are MDY, IJR, IWM, KRE, KBE.
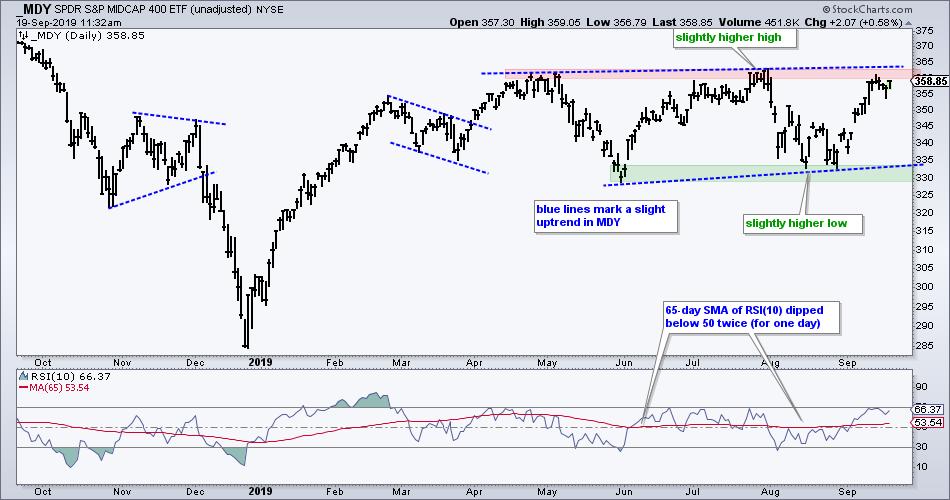
The S&P MidCap SPDR (MDY) is the strongest of this group because it is in a slight uptrend with a higher high from April to July and higher low from early June to early August. There is, however, a clear resistance zone in the 360-363 area and the 10-day SMA of RSI(10) dipped below 50 twice this summer. MDY surged in September and is challenging resistance as the 10-day SMA of RSI(10) moved above 50. A breakout could be in the making here.
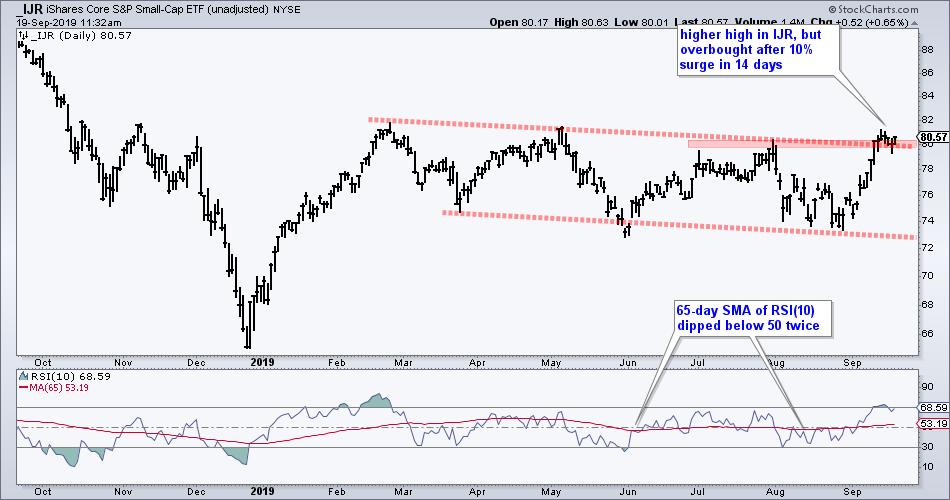
The S&P SmallCap iShares (IJR) forged a higher high with a move above the July high and the 65-day SMA of RSI(10) moved above 50 in early September. IJR is still close to the resistance zone, but a breakout is in the making for this small-cap ETF.
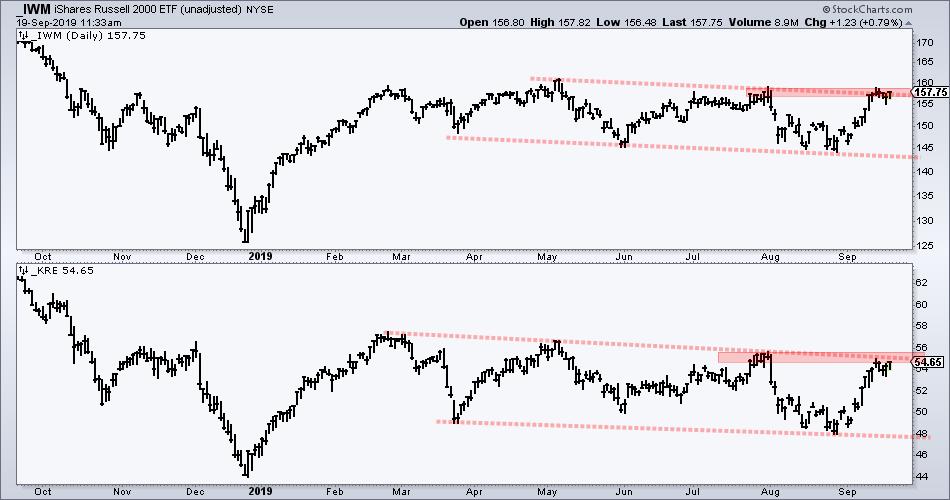
The next chart shows IWM and KRE together and the clear correlation between the two. The financial sector is the biggest sector in IWM and many of these financial stocks are regional banks. Both have been trending lower for months and both surged towards their July highs here in September. Follow through and breakouts by both would be bullish and suggest a continuation of the prior advance (late December to late February).
------------------------------------------------------------
IBB and XBI Find Support
ETFs in groups 6, 7 and 8 are in some sort of downtrends and lagging the broader market. I will not cover the last two groups because they are the weakest, but I will feature the charts in group 6 because they found support near their early June lows. The Biotech SPDR (XBI), and Biotech iShares (IBB) are testing their prior lows that may represent support. Even so, they are clearly lagging over the last five weeks and not performing that well. Breakouts are needed to put the bulls back in the driver's seat.
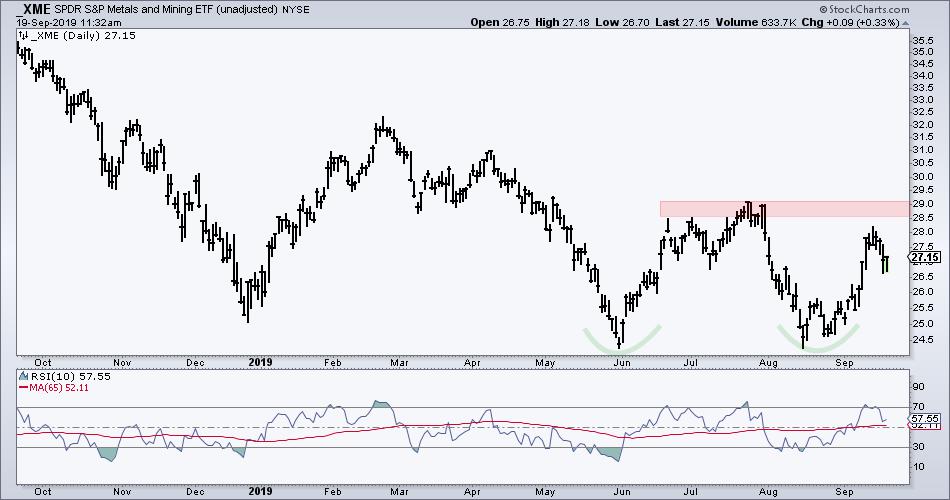
The Metals & Mining SPDR (XME) held the early June low and a double bottom could be taking shape. A break above the July high is needed to confirm this bullish reversal pattern and reverse the downtrend.
------------------------------------------------------------
Choose a Strategy, Develop a Plan and Follow a Process
Arthur Hill, CMT
Chief Technical Strategist, TrendInvestorPro.com
Author, Define the Trend and Trade the Trend
Want to stay up to date with Arthur's latest market insights?
– Follow @ArthurHill on Twitter


