
The S&P SmallCap iShares (IJR) and Russell 2000 iShares (IWM) are leading the market in September with 8.22% and 7.66% gains, respectively. As the PerfChart below shows, these gains are more than double the gains in the S&P 500 SPDR (SPY), Nasdaq 100 ETF (QQQ) and Dow Diamonds (DIA). The S&P MidCap SPDR (MDY) is up almost 6% and the EW S&P 500 ETF (RSP) is up around 5%. In short, small-caps and mid-caps are leading the September surge.
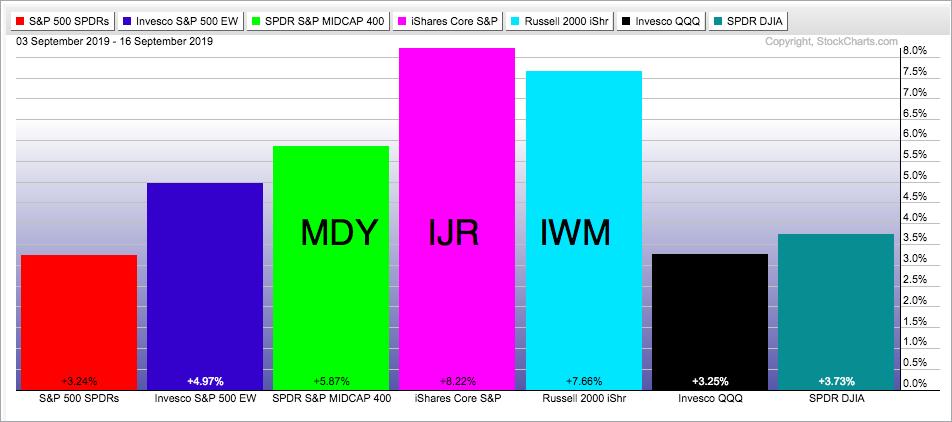
As noted last week, the breadth indicators turned net bullish for the S&P Small-Cap 600 and S&P Mid-Cap 400 with bullish breadth thrusts. The Index Breadth Model also turned net bullish on September 5th with a bullish breadth thrust from the S&P 500 (a week earlier).
------------------------------------------------------------
Choose IJR over IWM
In the battle of the small-cap ETFs, the S&P SmallCap iShares is performing better than the Russell 2000 iShares. First, the chart below shows IJR breaking above its late July high to forge a higher high. It also looks like IJR is breaking out of the falling channel extending from February to August.
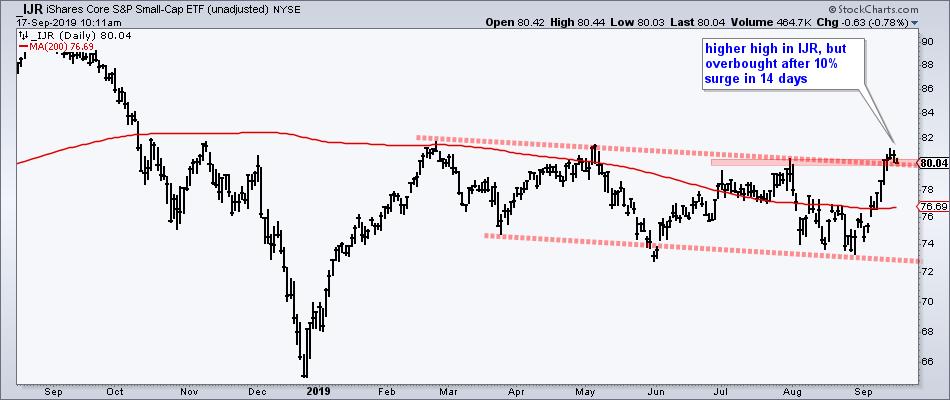
Even though IJR is looking bullish on the medium-term timeframe, it is short-term overbought after a 10% advance in just 13 days. This means it might be wise to wait for a pullback or consolidation before jumping on the small-cap bandwagon.
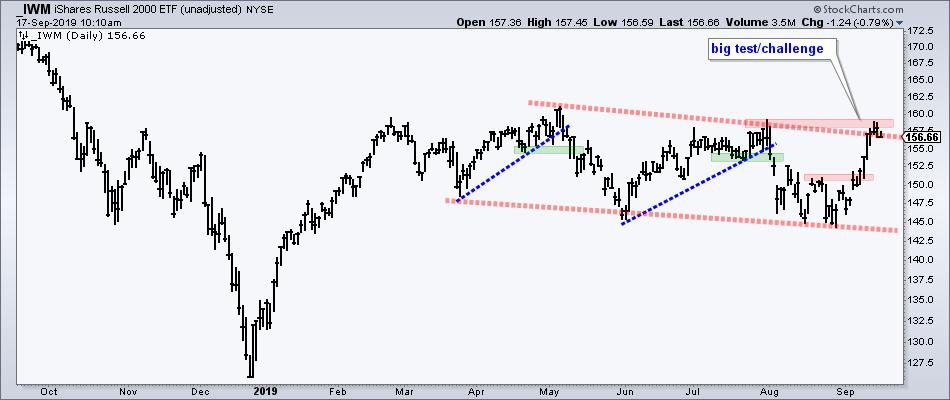
As the PerfChart above showed, the percentage gain in IWM was less than that in IJR, which means IWM lagged IJR short-term. In addition, IWM has yet to exceed the July high and forge a higher high. This tells me that IWM is lagging on the price chart.
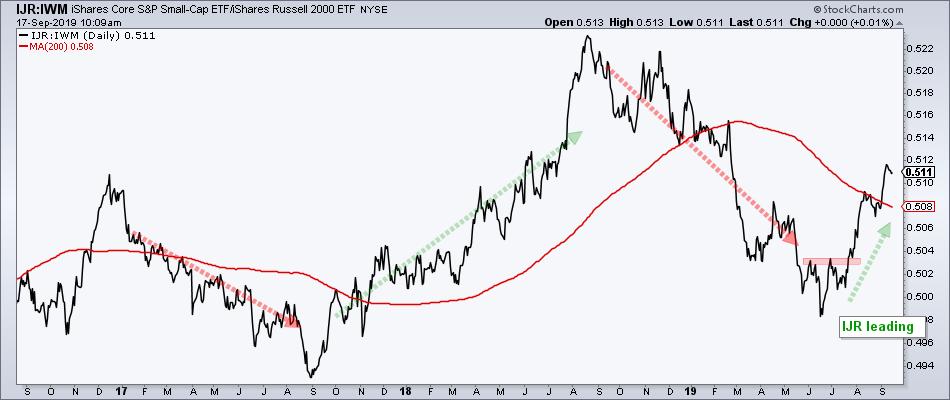
The next chart shows the IJR:IWM ratio in the top window. The price relative (IJR:IWM ratio) fell from August to June and then turned up in July as IJR began outperforming IWM. This ratio rose sharply in August-September as IJR continued outperforming IWM.
------------------------------------------------------------
Banks and Financials hold the Key
The Financials sector is the second biggest sector in the S&P SmallCap iShares and accounts for 17.59% of the ETF (Industrials is tops at 18.46%). Financials is the biggest sector in IWM and accounts for 17.64%. This implies that banks, especially smaller regional banks, play a large role in small-cap performance.
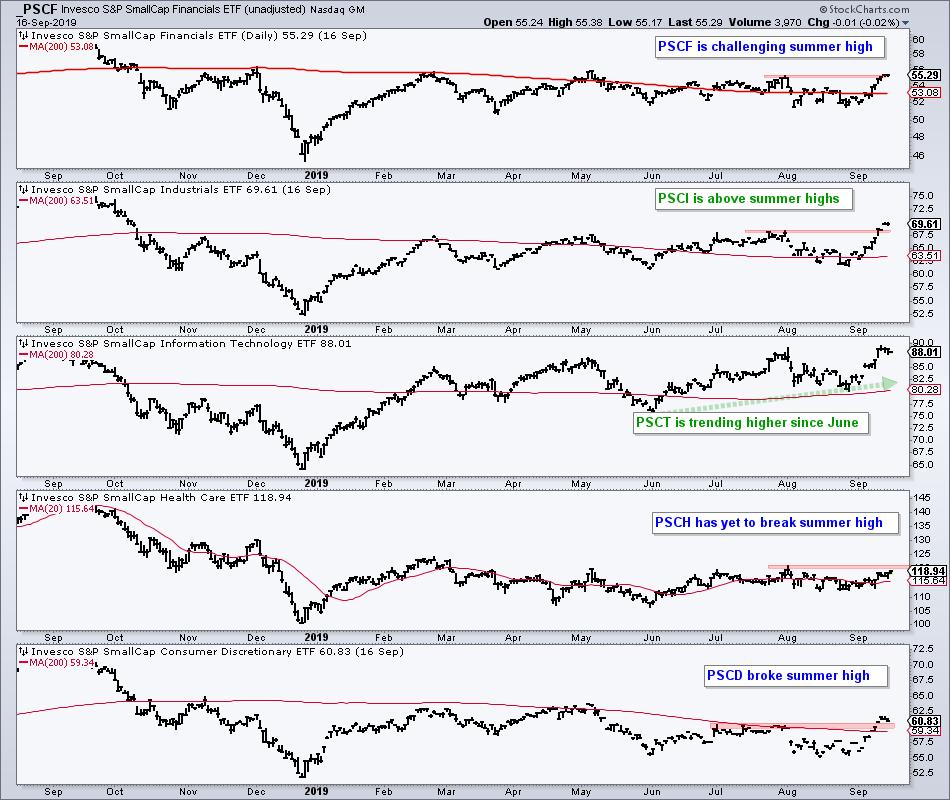
The chart below shows the top five sector ETFs in the S&P SmallCap iShares (IJR). Volume levels are too thin for trading, but these ETFs can still be used for basic trend analysis and to find the leading small-cap sectors. The SmallCap Technology ETF (PSCT) is the strongest with an uptrend since June, while the SmallCap Industrials ETF (PSCI) and SmallCap Consumer Discretionary ETF (PSCD) broke above their summer highs. The SmallCap Financials ETF (PSCF) is challenging its summer high and a breakout would be positive. The SmallCap HealthCare ETF (PSCH) is the weakest, but is also close to its summer high.
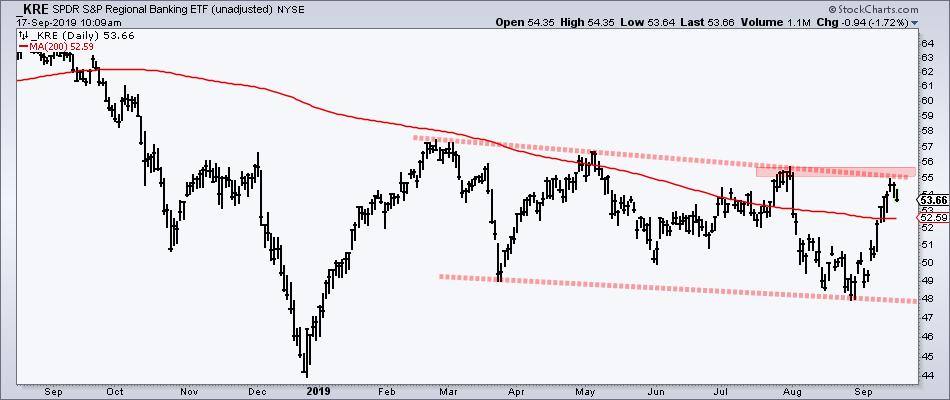
The chart below shows the Regional Bank SPDR (KRE) still within a falling channel, which extends from February to September. The ETF surged along with small-caps over the last 13 days, but remains short of a channel breakout, or a higher high. This is a moment-of-truth for KRE, and small-caps by extension.
------------------------------------------------------------
Choose a Strategy, Develop a Plan and Follow a Process
Arthur Hill, CMT
Chief Technical Strategist, TrendInvestorPro.com
Author, Define the Trend and Trade the Trend
Want to stay up to date with Arthur's latest market insights?
– Follow @ArthurHill on Twitter


