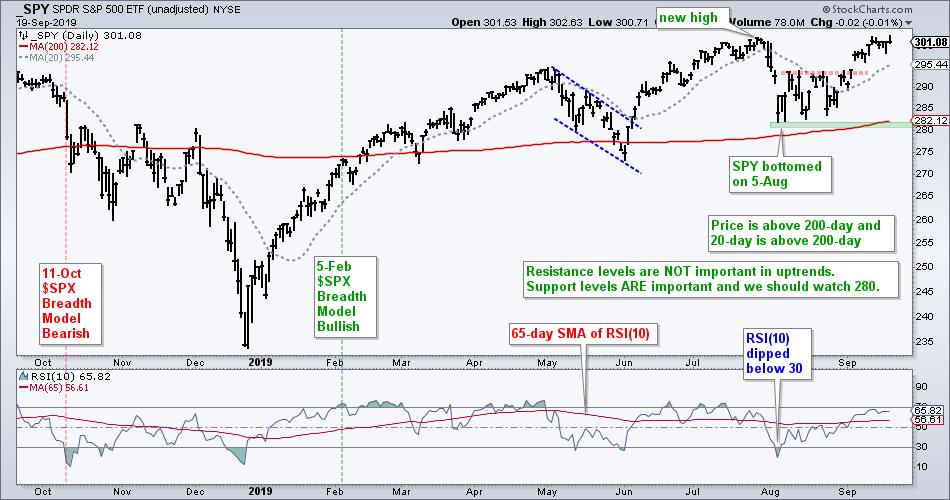
 The resurgence of small-caps has been greatly exaggerated. Consider this. The S&P 500 SPDR (_SPY) bottomed on August 5th and broke above its August highs on September 5th. The Russell 2000 iShares (_IWM) bottomed on August 27th and broke above its August highs on September 10th. SPY bottomed three weeks before IWM and SPY broke out five days before IWM. Sounds like SPY has a stronger price chart than IWM to me. Oh, and don't forget that SPY hit a new all time high in July and IWM has not even cleared its May high.
The chart below shows SPY in a clear uptrend since mid February, which is when the 65-day SMA of RSI(10) moved above 50, price moved above the 200-day and the breadth indicators were net bullish. SPY remains with this bullish configuration and I am setting key support at 280.
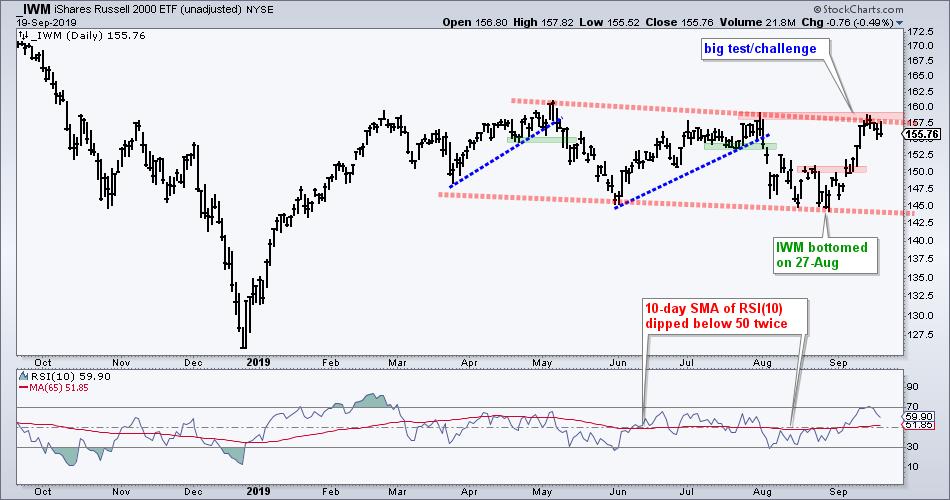
The next chart shows IWM surging to the July high and backing off this resistance level this week. I am marking resistance for IWM because it is in a clear downtrend over the last several months (lower lows and lower highs). A break above the July high is needed to forge a higher high and reverse this downtrend.
The PerfChart below shows performance for the major index ETFs since August 5th, which is when SPY bottomed. Even though IWM is up more than SPY in September, it is up less than SPY and QQQ since August 5th.
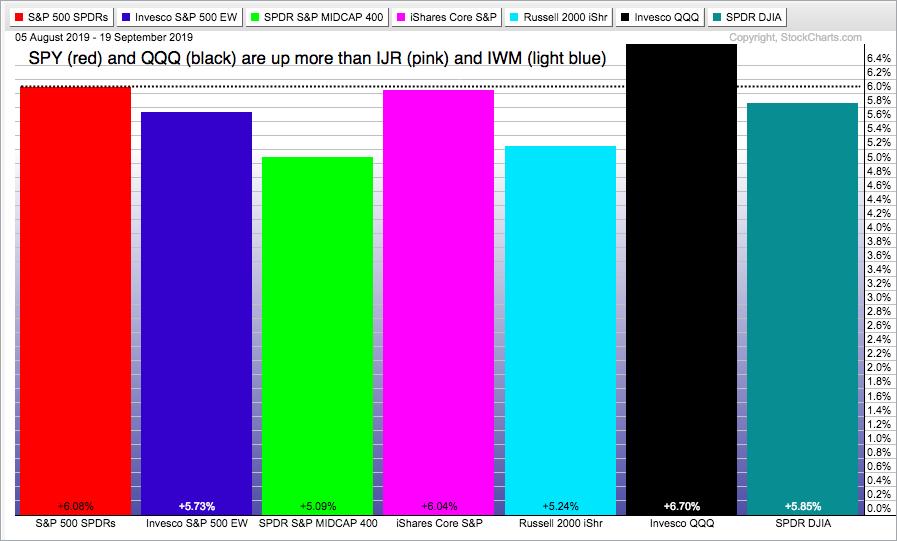
Putting it all together, IWM is leading in September, but still lagging since August 5th and clearly lagging on the price chart because it has yet to break out. SPY and QQQ are still the leaders and have yet to be dethroned.
------------------------------------------------------------
Techs and Utes Lead within SPY
We are also hearing a lot about the resurgence of the Industrials SPDR and Financials SPDR. They are part of the leadership group in September and they are outperforming SPY since August 5th, but they are not the top two performing sectors. Any guesses on the top performing sectors?
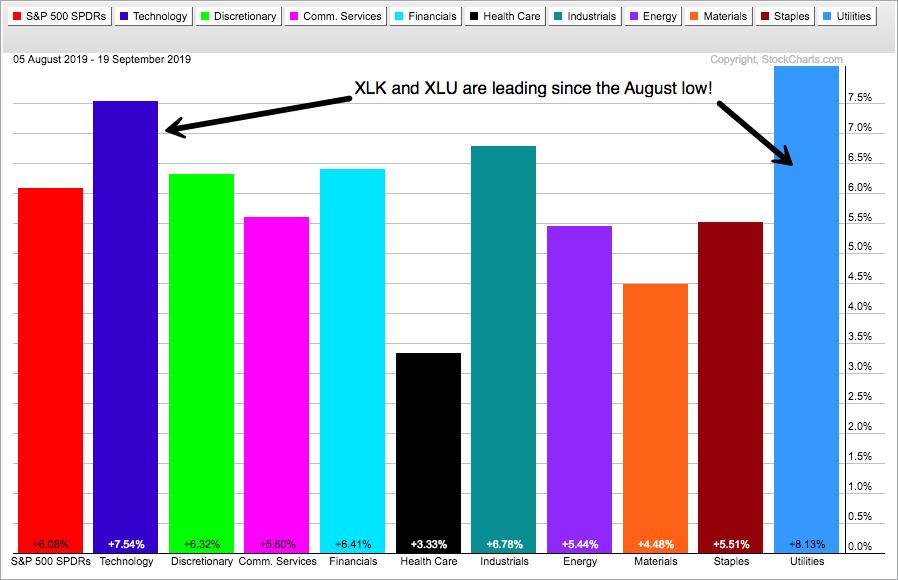
The PerfChart above shows the Technology SPDR and the Utilities SPDR leading since August 5th. Talk about two very different sectors! XLK represents the high growth and riskier end of the market, while XLU represents the high yield and defensive end of the market.
------------------------------------------------------------
Index Breadth Model Remains Bullish
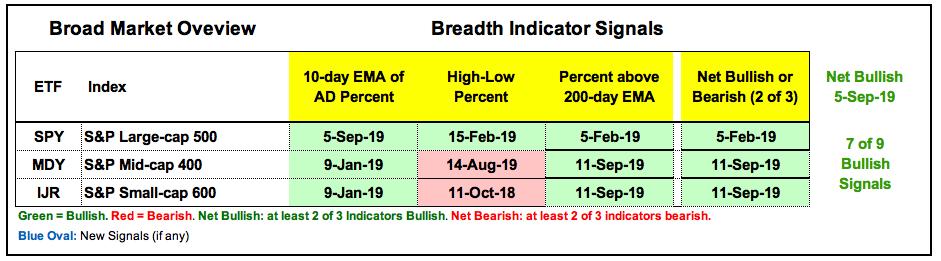
There is no change in the Index Breadth Model as seven of the nine indicators remain on active bullish signals (since September 5th). The S&P 500 has been net bullish since February 5th and is the undisputed leader with all three indicators on active bullish signals.
------------------------------------------------------------
New Highs Lag in Small and Mid Caps
Mid-caps and small-caps are net bullish, but the High-Low Percent indicators are still dragging their feet with bearish signals. The chart below shows S&P 500 High-Low% ($SPXHLP) turning bullish in mid February with a move above +10%. Admittedly, the High-Low Percent is not that impressive here in September, but the cup is still half full.
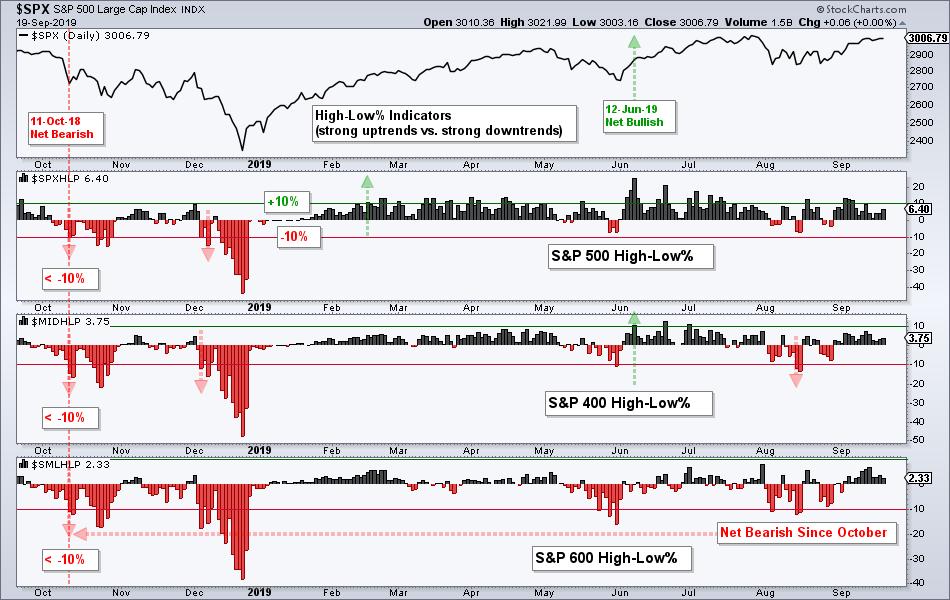
S&P 400 High-Low% ($MIDHLP) turned bullish in June, but flipped back to bearish in mid August with a move below -10%. Despite a strong advance here in September, $MIDHLP and S&P 600 High-Low% ($SMLHLP) have yet to get above +10% for bullish signals. This tells me that there are not very many strong uptrends in mid-caps and small-caps.
------------------------------------------------------------
Sector Breadth Model Remains Very Strong
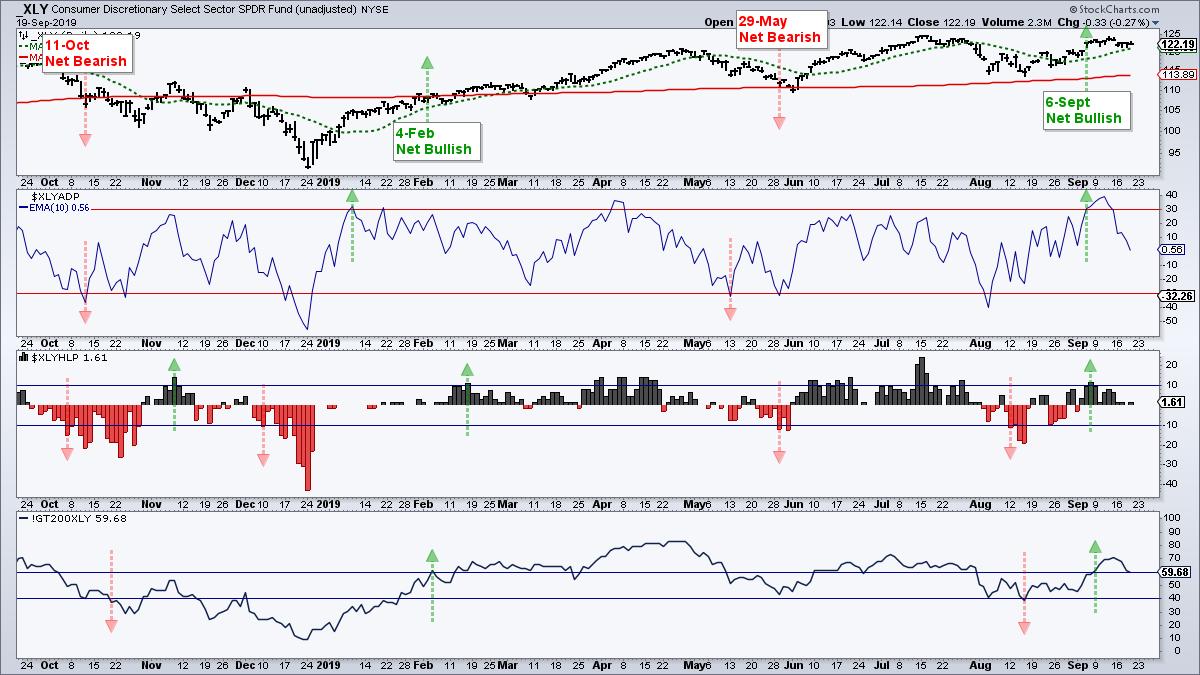
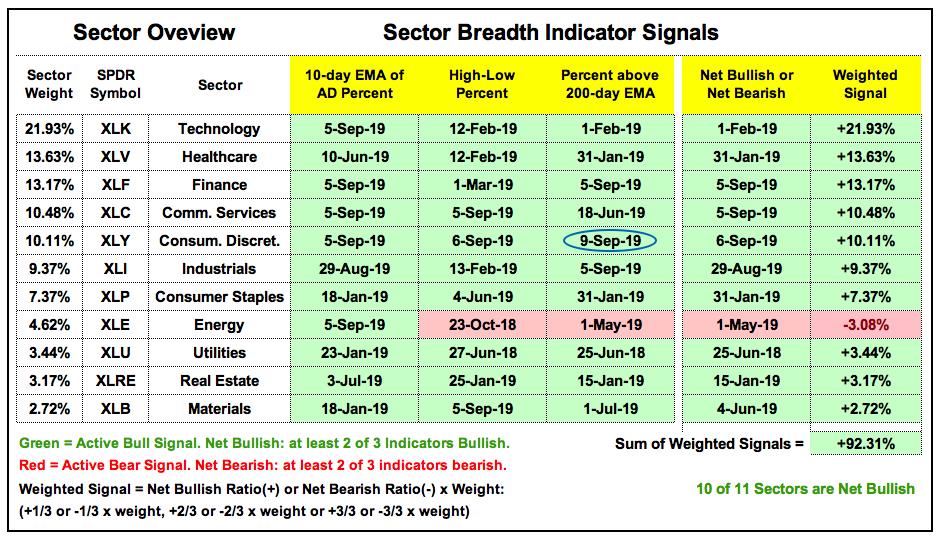
There is only one change in the Sector Breadth Model since the last update, which was on September 7th. The Consumer Discretionary %Above 200-day EMA (!GT200XLY) moved above 60% on September 9th to trigger bullish. XLY was already net bullish and this new signal puts all three indicators in bull mode.
The table shows 31 of 33 indicators on active bullish signals and 10 of 11 sectors net bullish. Energy is still the only sector that is net bearish. More importantly, the five big offensive sectors are bullish (Technology, Consumer Discretionary, Finance, Communication Services and Industrials). Throw in Healthcare, Materials and the three defensive sectors, and the weighted sum is +92.31%. It does not get much more bullish than that.
------------------------------------------------------------
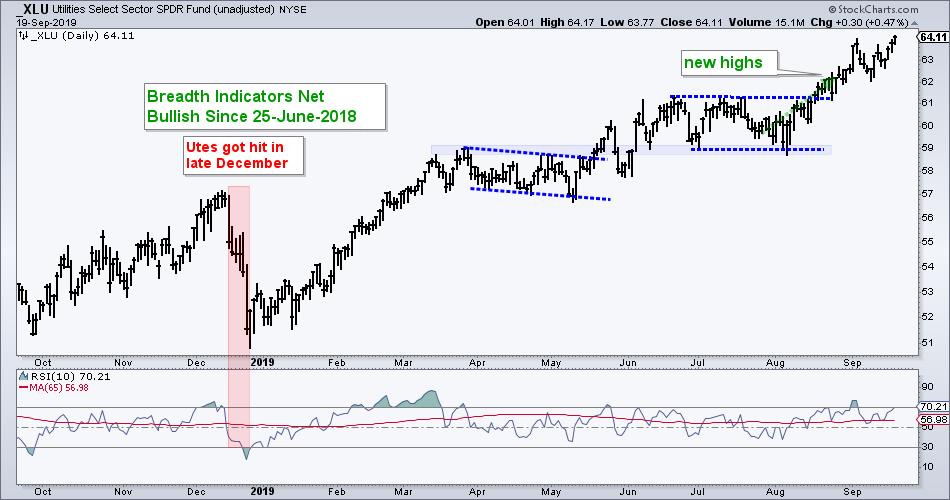
XLU, XLRE and XLP Still Leading
The next charts group the sectors by chart performance, best to worst. Only three sector SPDRs hit new 52-week highs in September and only one hit a new high this week. The chart below shows the Utilities SPDR (_XLU) closing above 64 on Thursday and hitting another new high. XLU is by far the strongest of the eleven sectors right now.
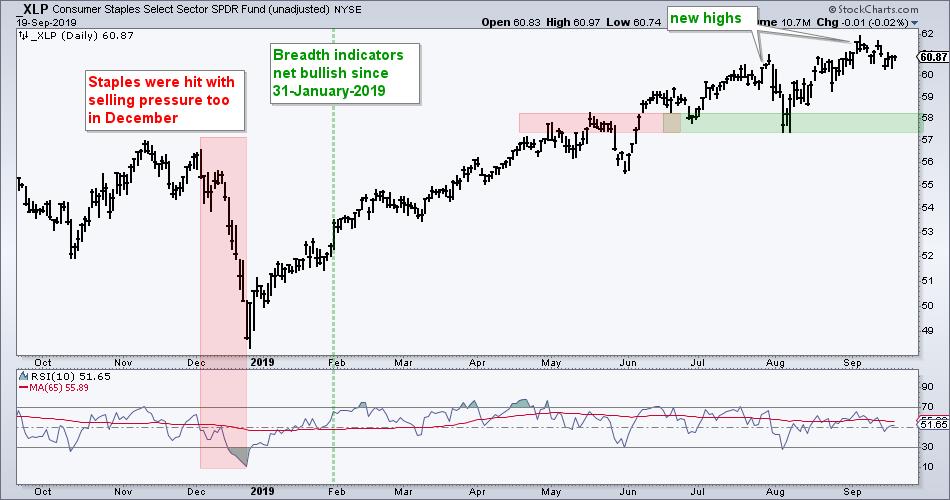
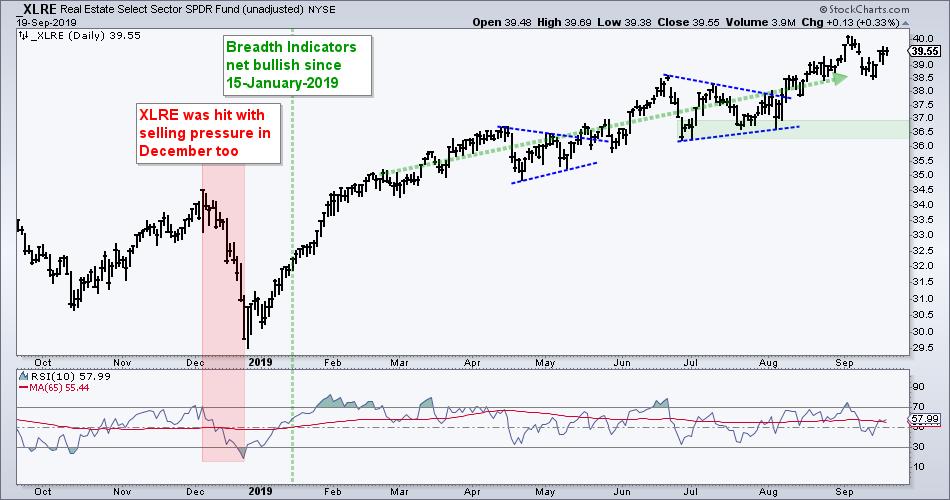
The Consumer Staples SPDR (_XLP) and the Real Estate SPDR (_XLRE) are not far behind and less than 2% from 52-week highs.
------------------------------------------------------------
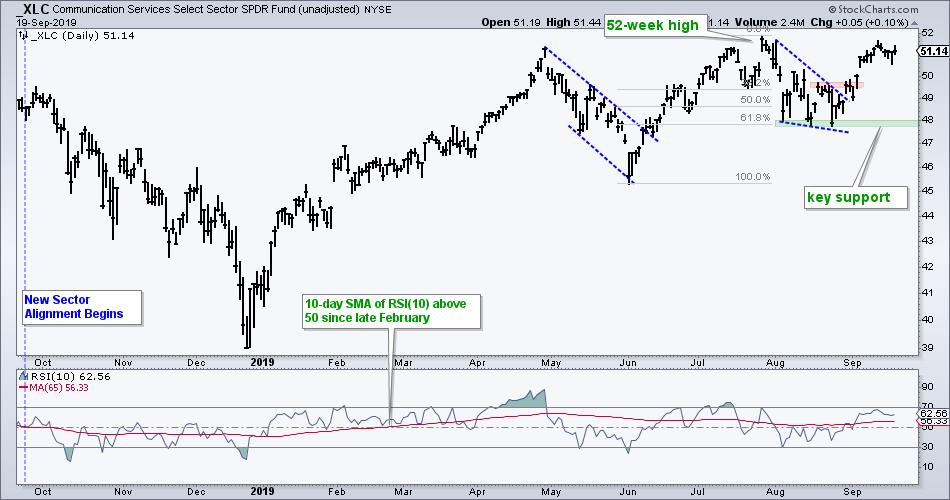
XLK, XLY and XLC Challenge July Highs
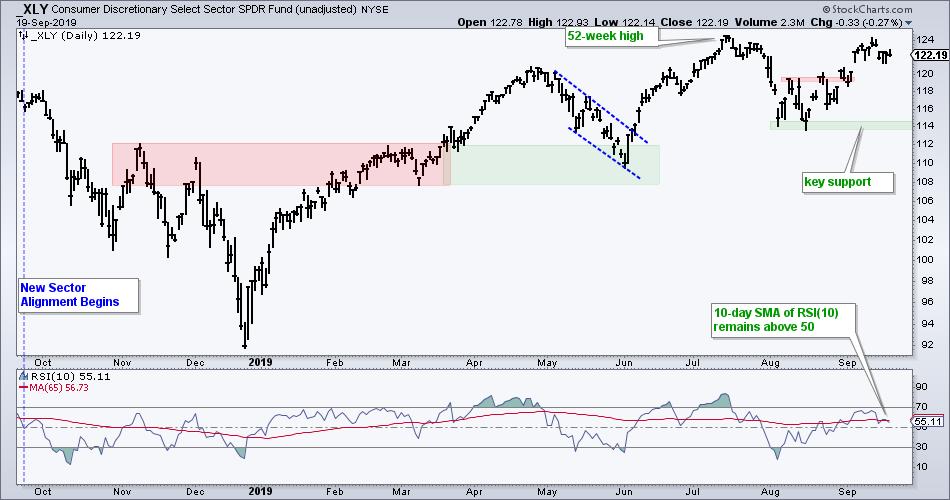
Even though Technology SPDR (_XLK), Consumer Discretionary SPDR (_XLY) and Communication Services SPDR (_XLC) are close to their highs, they did not record new highs in September and are not as strong as the three defensive sectors. Nevertheless, these three sectors are in uptrends overall and by no means weak. I do not consider the July highs as resistance levels because higher highs are expected in uptrends. Instead, I am marking key support using the August lows. The bounce over the last six weeks was impressive and these lows hold the key to the current uptrend. A break below these lows would be negative for the broader market.

------------------------------------------------------------
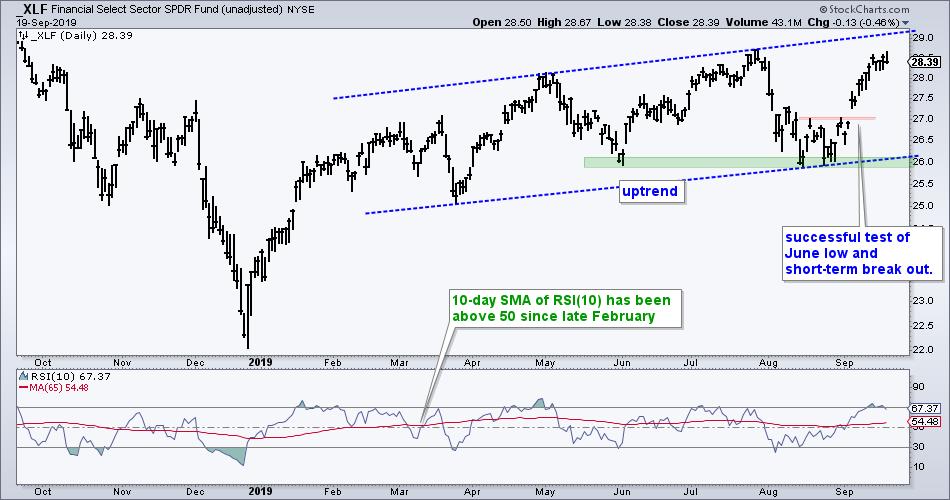
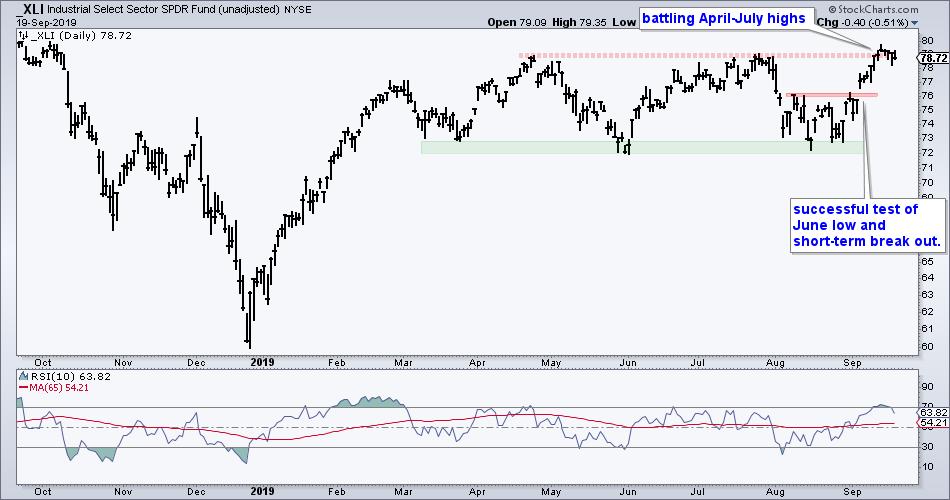
XLI, XLF and XLB Trend Higher
The first six sectors are in clear uptrends and leading. The Financials SPDR (_XLF) and the Industrials SPDR (_XLI) are also trending higher, but still not as strong as the prior six because they have yet to record 52-week highs this year. XLF may be a leading gainer the last three weeks, but the ETF has yet to clear its July high. XLI exceeded its July high for a day or two, but did not hit a 52-week high and fell back on Thursday.
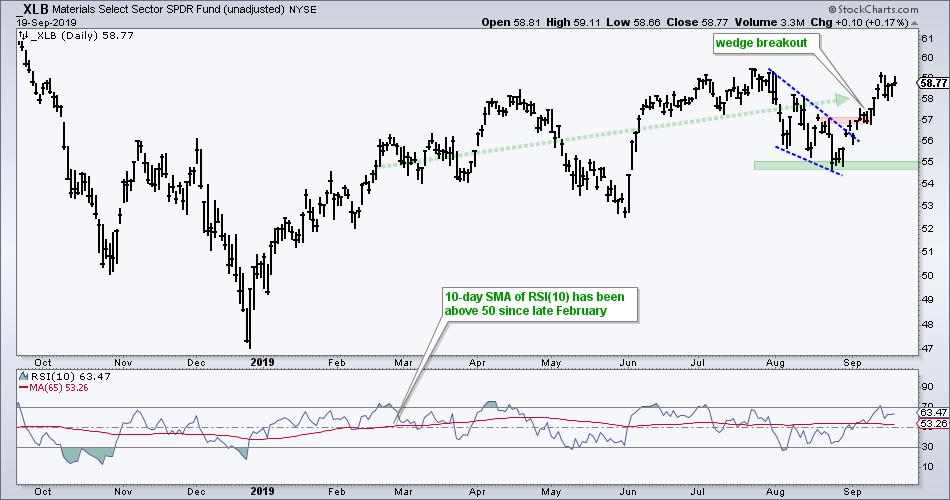
The Materials SPDR (_XLB) has been trending higher since the latter part of February, which is when the 10-day SMA of RSI(10) moved above 50 and prices exceeded their November highs. The ETF has since zigzagged higher with a wedge breakout in place since early September.
------------------------------------------------------------
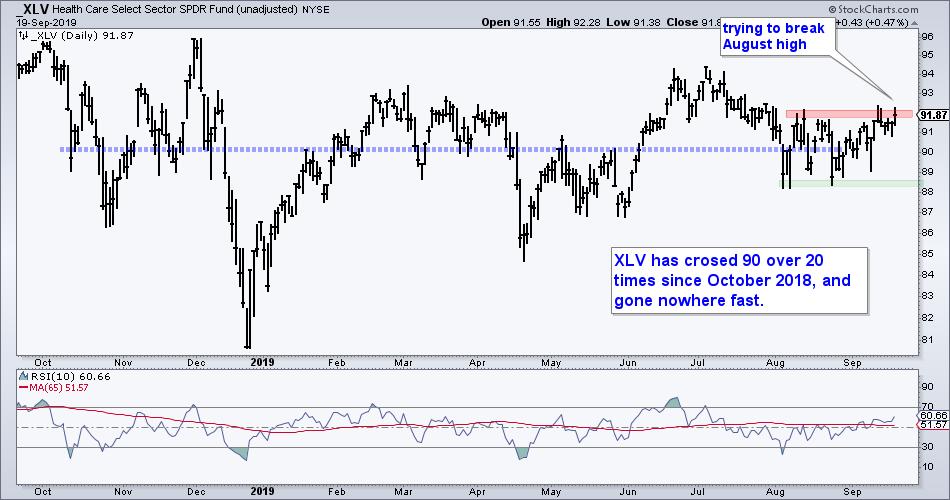
XLV Struggles
The Health Care SPDR (_XLV) continues to dance in circles around the 90 level with more than 20 crosses since October 2018. The ETF bounced with the rest of the market over the last three weeks, but remains just shy of a resistance breakout (August highs).
------------------------------------------------------------
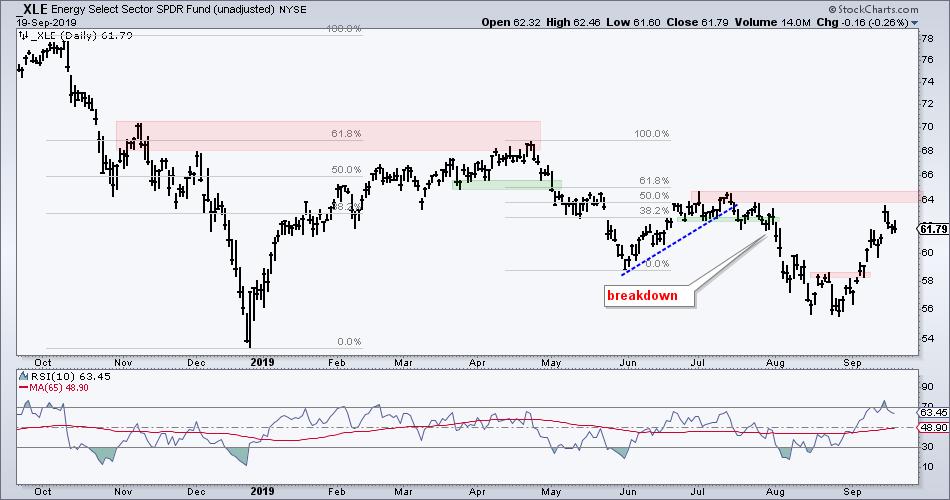
XLE Still in Downtrend
The Energy SPDR (_XLE) is up over 10% from its late August low, but it is still in a downtrend and still the weakest price chart overall. Even though XLE managed to hold above the December low in August and produce a market-leading bounce the last 16 days, it remains below the July highs and short of a breakout or higher high. In addition, the 65-day SMA of RSI(10) is below 50.
------------------------------------------------------------
Bottom Line

The broad market environment shifted from bearish to bullish in early September, and remains bullish. Even though IWM and IJR have the biggest gains in September, SPY and QQQ are the leading gainers since August and remain stronger on the price charts. The S&P 500 breadth indicators are also stronger because the High-Low Percent indicators have yet to trigger bearish for mid-caps and small-caps. It is still a large-cap world.
On the price charts, the S&P MidCap SPDR, Russell 2000 iShares and S&P SmallCap iShares are challenging resistance levels after the September surge, but remain short of convincing breakouts. In addition to MDY, IWM and IJR, also note that SPY, QQQ, XLK, XLY, XLC, XLI and XLF are trading near their summer highs. All told, we have ten key symbols at potential make-or-break levels. The first three are in trading ranges at best, while the latter six are still in uptrends. Breakouts and higher highs in the majority would argue for an extension of the September surge. Failures by the majority and downturns would be a concern, especially in the second half of September.
------------------------------------------------------------
This week on Art's Charts
Saturday - 21-Sept: Capturing Mean-Reversion Signals and Trend Direction with One Indicator - Facebook Example
Thursday - 19-Sept: Ranking and Grouping Key ETFs - Tech-related ETFs Hit Moment-of-truth, while Biotech ETFs Find Support
Tuesday - 17-Sept: Moment-of-truth for Small-caps and Regional Bank ETFs
------------------------------------------------------------
Choose a Strategy, Develop a Plan and Follow a Process
Arthur Hill, CMT
Chief Technical Strategist, TrendInvestorPro.com
Author, Define the Trend and Trade the Trend
Want to stay up to date with Arthur's latest market insights?
– Follow @ArthurHill on Twitter


