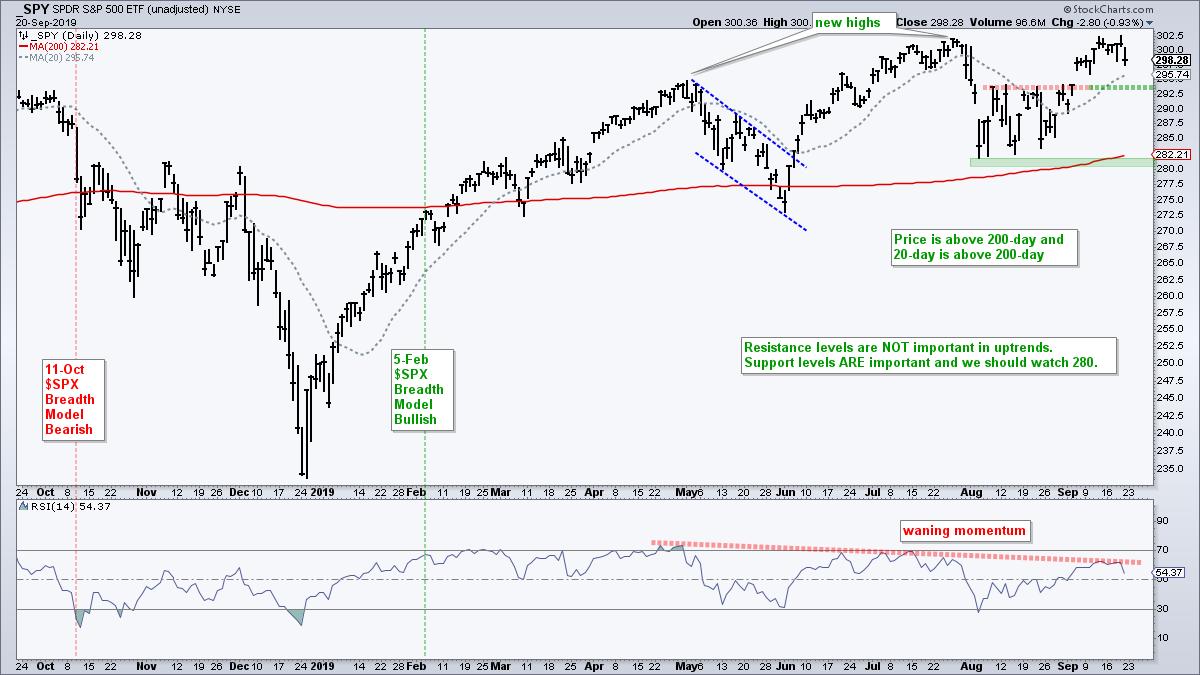
 Normally I ignore resistance levels in uptrends and support levels in downtrends. Resistance levels are not that important because higher highs are expected in an uptrend. The assumption is that a trend in motion stays in motion so a break above the prior peak is considered normal. Support levels, on the other hand, are important because they are expected to hold, and thus, hold the key to the uptrend. A break below a key support level would forge a lower low and call for a reassessment.
Technical analysis is a combination of the objective and the subjective. Objectively, the Nasdaq 100 ETF (QQQ) hit 52-week highs in April and July, and is above the rising 200-day SMA. The long-term trend is up with the August lows marking key support going forward. A close below these lows and the 200-day SMA would call for a reassessment.
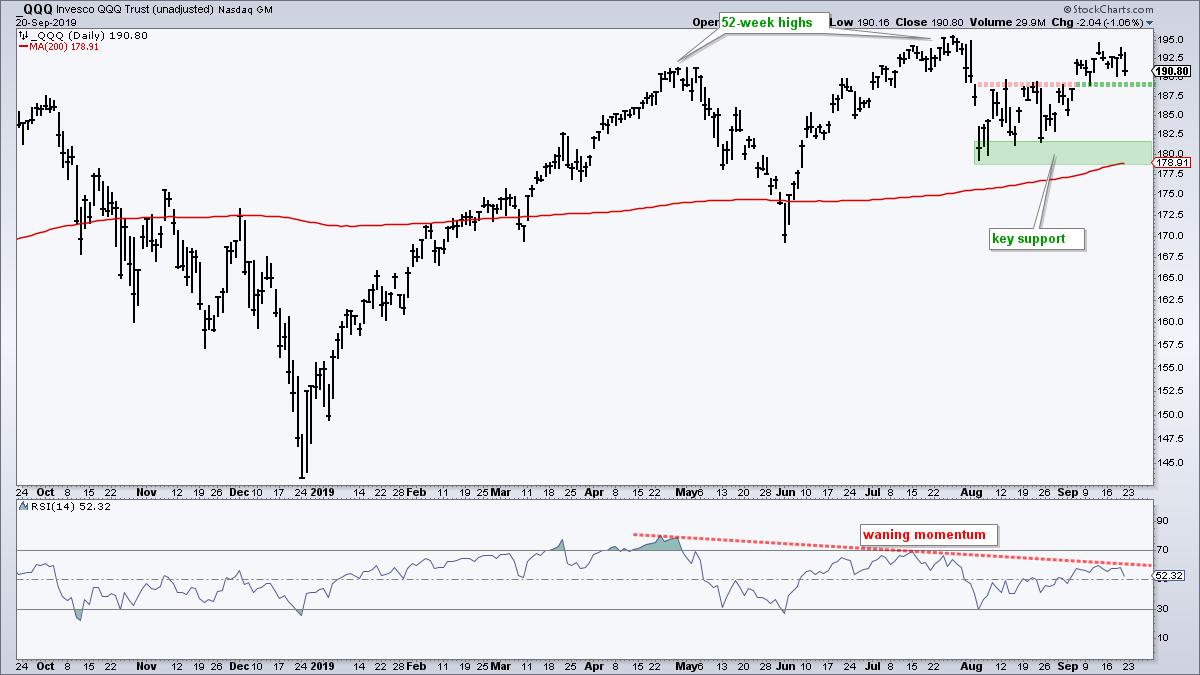
On the more subjective side, notice that momentum is waning and RSI formed a rather large bearish divergence. Note that most major tops are marked with a bearish divergence, but not all divergences result in major tops. Divergences did not work well in 2017 and had mixed results in 2018. One could say that bearish divergences have called 10 of the last 3 major reversals. Nevertheless, RSI did not get back above 70 in July and did not get back above 60 in September. Upside momentum is clearly waning so I am watching price action closely.
Moving to the shorter term, notice that QQQ broke out of its August range with a gap on September 5th. SPY also broke out with such a gap and this was the range breakout heard around the world. It best hold. A move back below 188 would fill the 5-Sept gap and negate this range breakout. Combined with waning momentum, this would provide the second sign of trouble (strike 2). A break below the August low would signal strike three and reverse the uptrend. We only have one strike now, but this is what to watch next week.
The next chart shows the S&P 500 SPDR (SPY) with similar characteristics (long-term uptrend, waning momentum, August breakout). A close below 294 would fill the 5-Sept gap and negate the August breakout. The rising 200-day SMA, August lows and a small buffer mark support in the 280-282 area. A close below 280 would provide strike three call for a reassessment of the long-term uptrend.
Links for this week's articles can be found at the bottom of this commentary.
------------------------------------------------------------
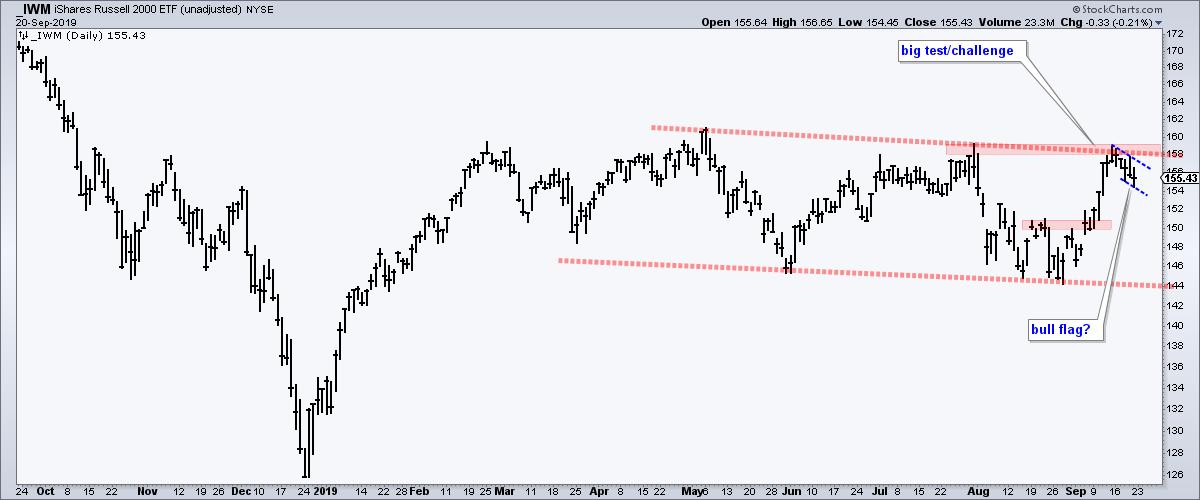
Major Resistance
Are small-caps leading or lagging? It depends on your timeframe and your ETF (the S&P SmallCap iShares (IJR) or Russell 2000 iShares (IWM)). IJR and IWM are lagging over the past year, year-to-date and six month timeframes. IJR (+2.18%) is leading SPY (+1.78%) on the 3-month timeframe, but IWM (+.09%) is lagging SPY. IWM and IJR are leading SPY on the one month timeframe, but lagging this past week.
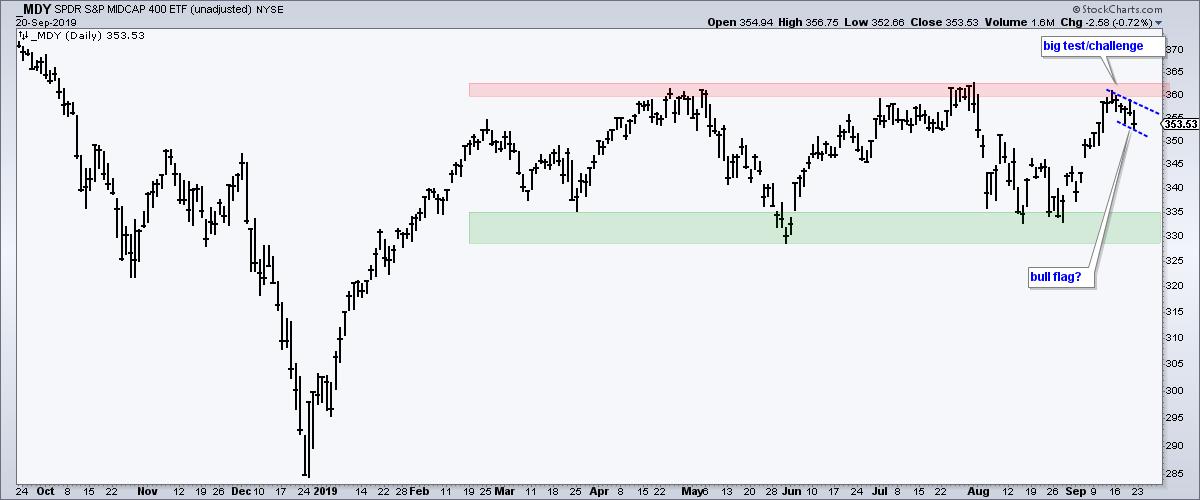
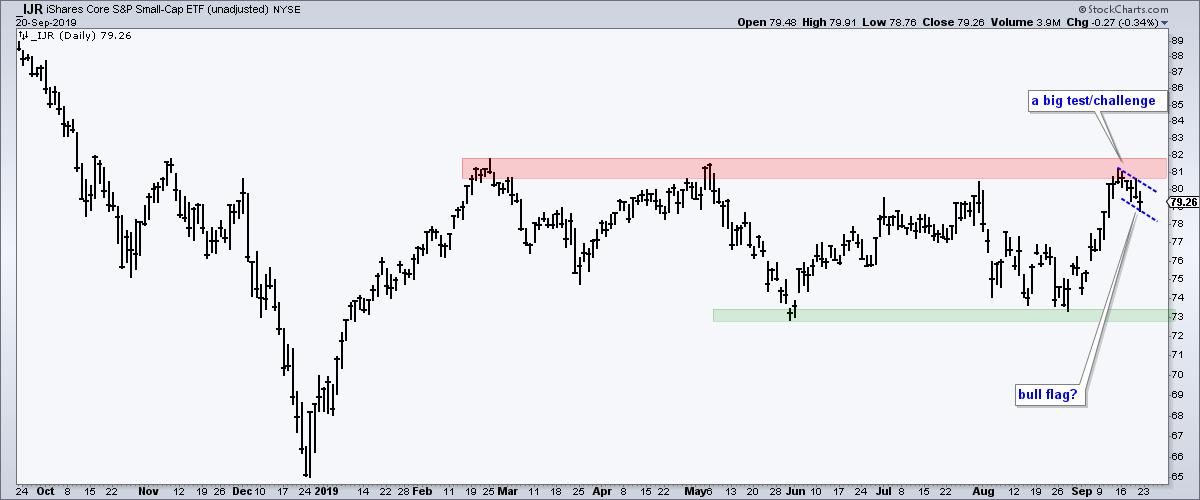
But what about the price charts? IJR, IWM and the S&P MidCap SPDR (MDY) are clearly lagging on the price charts. MDY and IJR have been stuck in trading ranges since March, while IWM has trended lower the last five months. The SPY and QQQ charts are clearly stronger than these three charts. Moreover, MDY, IJR and IWM are hitting major resistance zones (red shading) and remain short of convincing breakouts. The blue lines mark pullbacks this week that look like falling flags. Flag breakouts are needed to signal a continuation of the prior surge and open the door to bigger breakouts.
------------------------------------------------------------
Summing up Resistance
The next chart shows all five ETFs with the red zones marking potential resistance and major resistance. SPY and QQQ are at potential resistance levels because the bigger trends are still up. MDY is at a major resistance zone that extends back to late April. IJR and IWM are at major resistance zones that extend back to late February. The latter two have gone nowhere for seven months.
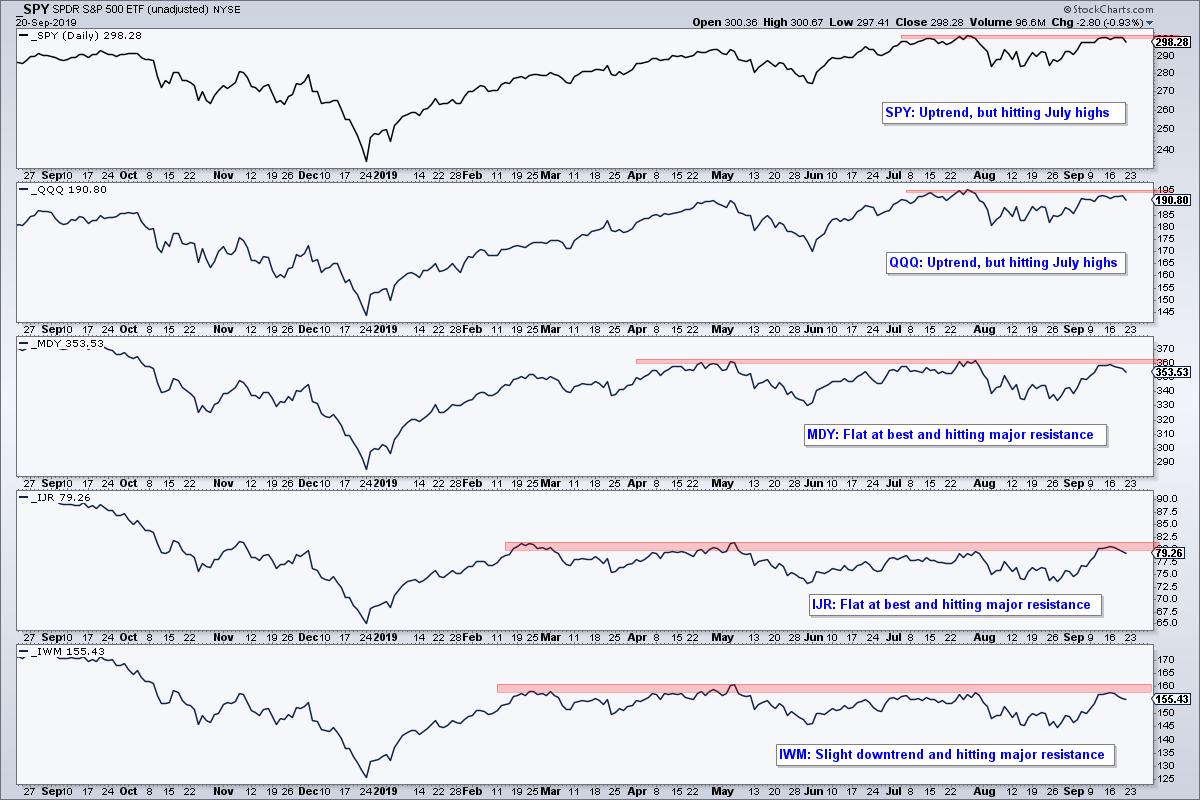
There are two possibilities to watch in the coming weeks. On the bull side, SPY and QQQ need to move above their July highs, while MDY, IJR and IWM need to break out of their falling flags. Follow through breaks above the major resistance zones would be quite bullish. On the bear side, short-term support breaks in SPY and QQQ would be negative, especially with MDY, IJR and IWM failing at major resistance levels.
-----------------------------------------------------------
This week on Art's Charts
Saturday - 21-Sept: Capturing Mean-Reversion Signals and Trend Direction with One Indicator - Facebook Example
Friday - 20-Sept: State of the Stock Market - Meet the New Leaders, Same as the Old Leaders
Thursday - 19-Sept: Ranking and Grouping Key ETFs - Tech-related ETFs Hit Moment-of-truth, while Biotech ETFs Find Support
Tuesday - 17-Sept: Moment-of-truth for Small-caps and Regional Bank ETFs
------------------------------------------------------------
Choose a Strategy, Develop a Plan and Follow a Process
Arthur Hill, CMT
Chief Technical Strategist, TrendInvestorPro.com
Author, Define the Trend and Trade the Trend
Want to stay up to date with Arthur's latest market insights?
– Follow @ArthurHill on Twitter


