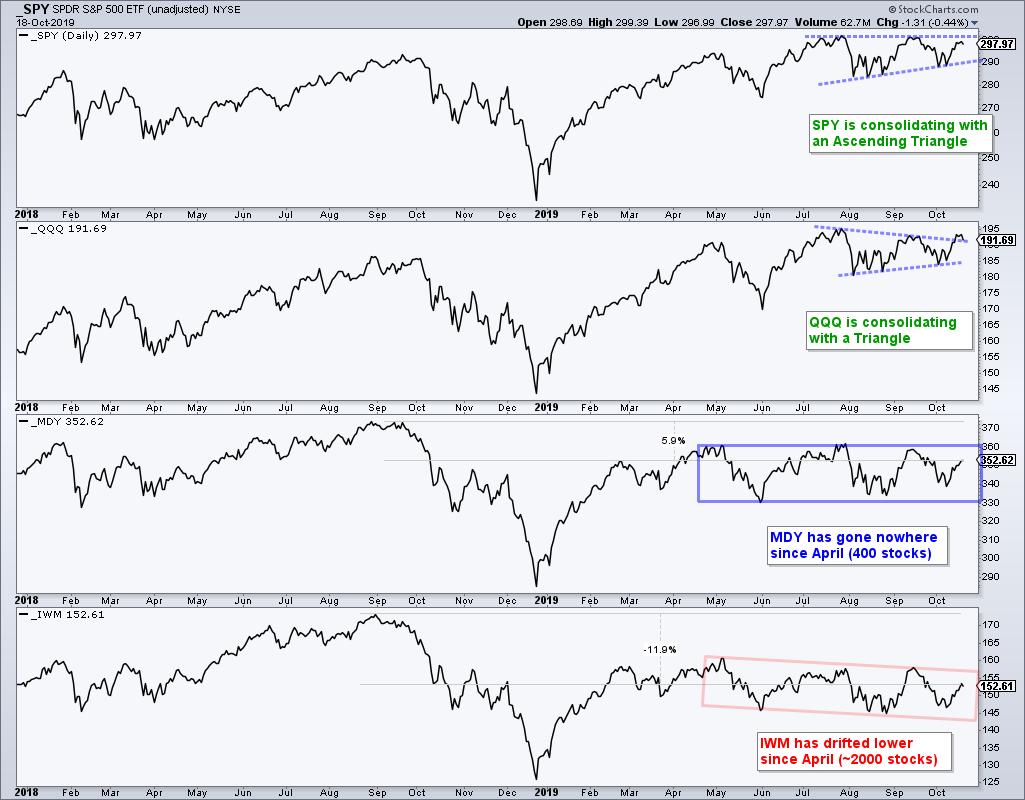
 While the S&P 500 and large-caps hold up well, small-caps and mid-caps continue to trade mixed. This suggest that the average stock is trading mixed, some up and some down. Even though we are not in a bear market environment, stock picking is challenging right now and we should lower our expectations, and perhaps exposure.
The mixed nature of the market is also reflected in the price charts for the major index ETFs. SPY and QQQ have traded flat since July (3 months). The Russell 2000 ETF has been working its way lower since April and the S&P MidCap 400 SPDR has been flat since April. The consolidations in SPY and QQQ come after new highs and both are within 2% of their all time highs. IWM is some 13% below its 2018 high and MDY is 6% below.

This Week on TrendInvestorPro.com
I will still contribute to StockCharts on a limited basis, but the bulk of my work will be on TrendInvestorPro from here on out. TrendInvestorPro.com offers market timing and trend-momentum strategies. As with Art's Charts, the analysis is objective, systematic and educational.
Saturday - 19-Oct: Weekend Market Review and Stock Setups
Saturday - 19-Oct: Few New Highs, but Even Fewer New Lows - Watching the Sector High-Low Lines for Clues on the Current Upswing
Friday - 18-Oct: The State of the Stock Market - There are Two Sides to Every Coin – Don't Forget to Consider Both
Thursday - 17-Oct: ETF Ranking and Grouping – Some Long-term Laggards Start Showing Signs of Relative Strength
Thursday - 17-Oct: ETF ChartBook - Table showing ETF Rankings and Grouping plus all 60 ETF charts with annotations and comments.

Choose a Strategy, Develop a Plan and Follow a Process
Arthur Hill, CMT
Chief Technical Strategist, TrendInvestorPro.com
Author, Define the Trend and Trade the Trend
Want to stay up to date with Arthur's latest market insights?
– Follow @ArthurHill on Twitter


