The S&P 500 SPDR (SPY) hit a new high in July and then moved into a trading range the last few months. Momentum turned down during this trading range and this is perfectly normal during a consolidation. Today will look at a weekly chart pattern taking shape and show by we need to look at both sides of the momentum coin.
The current consolidation in SPY is a consolidation within an uptrend and you know what I am going to say next. A consolidation after an advance is a bullish continuation pattern. Sure, not all bullish consolidations resolve higher, but the odds favor a bullish resolution when the bigger trend is up. Moreover, with a higher low from August to October and equal highs in July and September, this consolidation looks like a classic Ascending Triangle, which is a bullish continuation pattern.
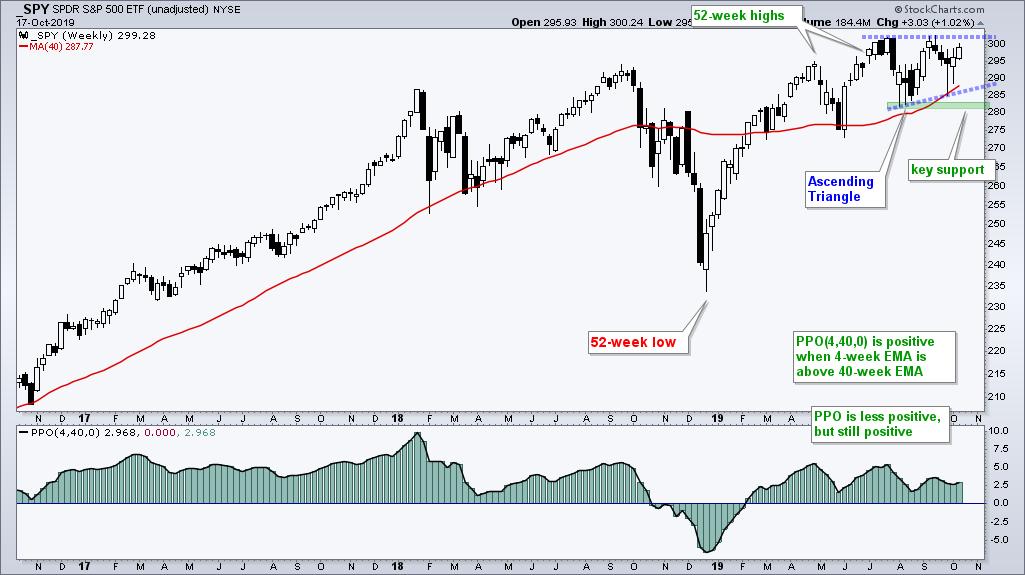
The indicator window shows the weekly PPO(4,40,0) to measure momentum. One side of the coin shows waning upside momentum, while the other shows upside momentum outpacing downside momentum. Momentum is clearly slowing, but less upside momentum is not outright bearish, especially when it comes after a new high. Momentum indicators flatten or even decline during consolidation phases because prices are moving sideways. Duh! The indicator window shows the PPO failing to exceed its April high this summer and forming a lower high in September. Yes, upside momentum is slowing. However, the PPO is still positive and this means there is more upside momentum than downside momentum. Again, look at both sides of the coin.
Special Announcement
TrendInvestorPro.com is in da house! From here on out I am the Chief Technical Strategist at TrendInvestorPro.com, a website offering market timing and trend-momentum strategies. As with Art's Charts, the analysis is objective, systematic and educational. I will still contribute to StockCharts on a limited basis, but the bulk of my work will be on TrendInvestorPro.
Access to the website is free this week. Next week I will open up for subscriptions so stay tuned! Analysis is geared towards the weekend trader or investor with the publishing schedule as follows:
- Thursdays - ETF Ranking and Grouping: Systematic ranking and grouping of 60 core ETFs for trend-rotation strategies. This report includes chart analysis and a PDF ChartBook featuring all 60 ETF charts with annotations and comments.
- Fridays - The State of the Stock Market: Broad market analysis and timing with index and sector breadth models.
- Saturdays - Stock Setups: A weekend report highlighting stocks with uptrends and bullish setups (when the broad market environment is bullish). Should the market environment turn bearish, I would then highlight stocks with bearish setups.
I will also publish periodic strategy pieces and educational content.
Click here to read today's report at TrendInvestorPro.com
Let the new journey begin!

Choose a Strategy, Develop a Plan and Follow a Process
Arthur Hill, CMT
Chief Technical Strategist, TrendInvestorPro.com
Author, Define the Trend and Trade the Trend
Want to stay up to date with Arthur's latest market insights?
– Follow @ArthurHill on Twitter


