 The goal of this commentary is to cut through the day-to-day noise and focus on price action that actually matters. Noise can be in the form of news or random price fluctuations. Either way, we are often better off when we filter the noise and focus on what really matters.
So what really matters? Trends and relative chart strength, which I measure with benchmark highs and lows. ETFs in downtrends and at support may seem to offer a good risk/reward ratio for a new long position, but the chances of success are greatly reduced because the overall downtrend is the dominant force at work. Avoiding ETFs that are in downtrends and that show relative chart weakness is the first step to investing success.
I am here to cut through the noise and find the ETFs with uptrends and relative chart strength. I do this by breaking down my core ETF universe into groups based on benchmark highs and lows. While I do not have a fixed number of groups, there is a clear delineation between ETFs in uptrends and downtrends. The ETF is either trending higher and leading or it is not.
Trend and relative strength are two of the most important concepts in investing. Investors focused on uptrends and relative chart strength have a better chance of positive expectancy and outperformance. There are no guarantees, but I think this is one of the better strategies to implement over the long haul.
------------------------------------------------------------
Group Summary
ETFs in the top three groups are still in uptrends of varying degrees, while ETFs in the bottom three groups are in downtrends. The defensive sectors, housing and bonds dominate the top group. ETFs in group 2 were leading not too long ago, but pulled back over the last few weeks. The Semiconductor ETF (SOXX) and Gold SPDR (GLD), for example, have bull flags working.
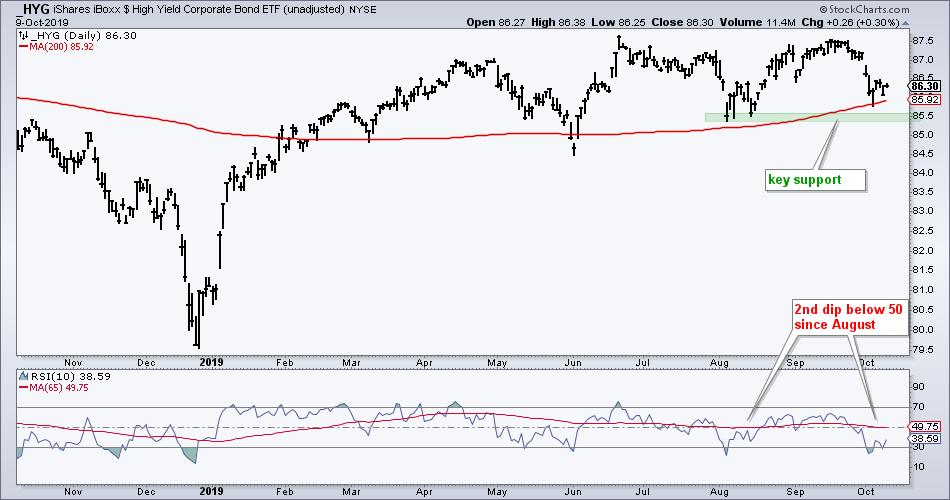
Of note, group three contains ETFs that are either consolidating within uptrends or forming tops. Yes, there is a fine line between the two. The S&P 500 SPDR (SPY), Finance SPDR (XLF) and High-Yield Bond ETF (HYG), for example, could be forming double tops and support breaks would be quite negative for the broader market.
ETFs in group four represent the biggest shift in the stock market over the two months. Namely, we have seen some key tech-related groups move from leaders to laggards and uptrends to downtrends. The Internet ETF (FDN), Cyber Security ETF (HACK) and Cloud Computing ETF (SKYY) broke key support levels and formed lower lows to start downtrends in September. This is a big development because the Technology sector is still the biggest weight in the S&P 500.
And finally, groups 5 and 6 are seriously lagging the others and in established downtrends. The Russell 2000 ETF (IWM) and Regional Bank ETF (KRE) have been trending lower for months and underperforming for most of 2019. I put the S&P MidCap 400 SPDR (MDY) in group 5 because it has been rangebound since February and underperforming.
Group 1: Uptrends and Leading
- XLU, ITB, XHB, AGG, TLT, TIP, MBB, MUB, UUP
Group 2: Uptrends and Pulling Back
- USMV, XLRE, IYR, XLP, SOXX, KIE, ITA, VIG, PFF, GLD, SLV
Group 3: Consolidating or Topping?
- SPY, QQQ, MTUM, XLK, XLY, XLF, XLI, XLC, TAN, IHI, HYG
Group 4: Relatively New Downtrends
- FDN, FINX, HACK, SKYY, IGV, IPAY
Group 5: Multi-month Downtrends or Ranges
- MDY, IWM, IJR, XLV, KRE, KBE, REM
Group 6: Strong Downtrends
- XLE, XRT, IBB, XBI, IHF, MJ, XES, XOP, XME, FXE
Note that I precede all my chart symbols with an underscore (_SPY) to chart unadjusted data, which is data without dividend adjustments. Dividend adjustments are good for seeing the total return picture, but I prefer unadjusted data for charting purposes. Dividend adjustments add the dividend back to historical prices. This literally changes the historical data with each dividend and creates an upward skew. Looking for an example? Compare XLU with _XLU over a 10 year period.
------------------------------------------------------------
Group 1: Uptrends and Leading
XLU, ITB, XHB, AGG, TLT, TIP, MBB, MUB, UUP
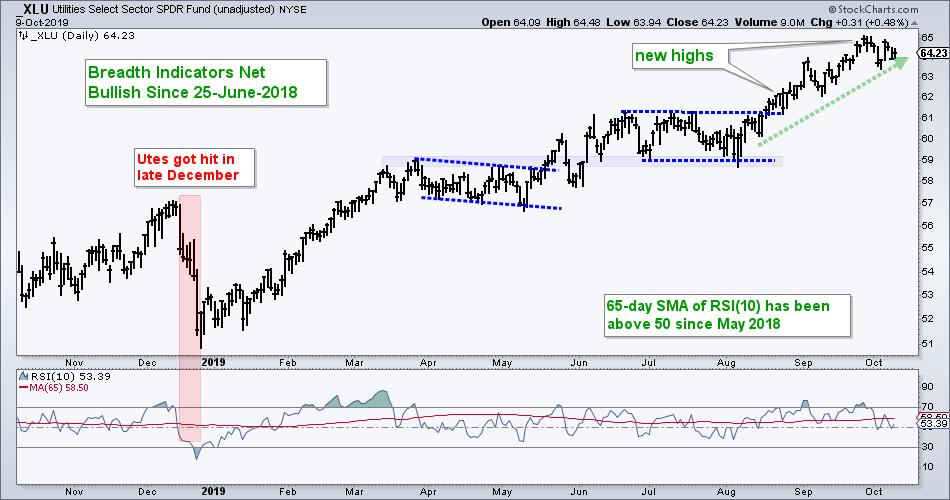
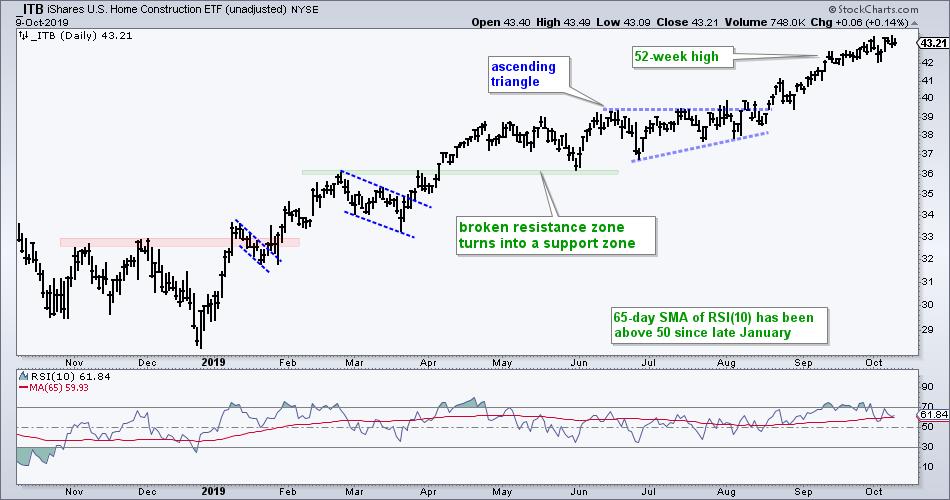
Group 1 represents ETFs that either hit new highs in late September or resumed their uptrends over the last few weeks. The Utilities SPDR (XLU) and Home Construction ETF (ITB) are leading on the equity side with new highs in late September.
The first chart shows XLU breaking out in mid August and hitting new highs throughout September. The 65-day SMA of RSI(10) has been above 50 for over a year and RSI(10) has not been below 30 since late December. The inability to become oversold is testament to the strength of the uptrend this year.
The next chart shows the Home Construction ETF (ITB) breaking out of an Ascending Triangle and working its way higher throughout September, and into October.
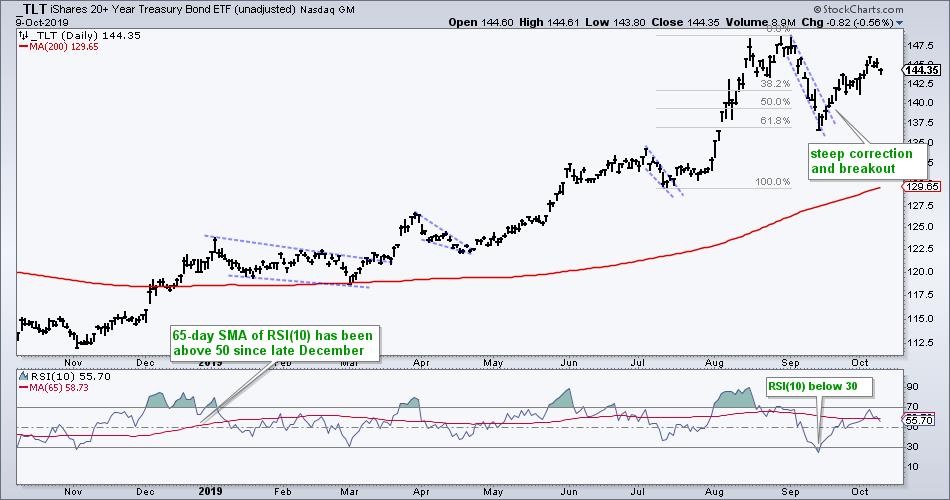
The 20+ Yr Treasury Bond ETF (TLT) corrected hard in the first half of September with a decline back to the 136 area, and 61.8% retracement. After becoming oversold (RSI<30), the ETF resumed its uptrend with a bounce the last four weeks. Even though TLT has yet to hit a new high, the resumption of the uptrend is enough to earn it a spot in the top group.
------------------------------------------------------------
Group 2: Uptrends and Pulling Back
USMV, XLRE, IYR, XLP, SOXX, KIE, ITA, VIG, PFF, GLD, SLV
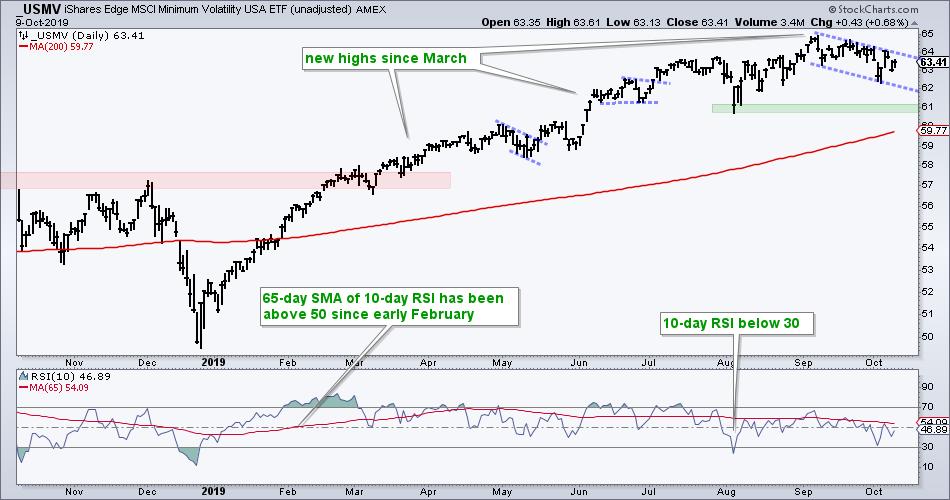
ETFs in group 2 were leading in August and early September, but pulled back over the last three to five weeks. These pullbacks are still deemed corrective in nature because they started from 52-week highs and these ETFs did not test their August lows.
The first chart shows the S&P 500 Minimum Volatility ETF (USMV) hitting a new high in early September and then edging lower. This decline is not a trend changing event. It looks like a falling flag and is just enough to place USMV in the second tier (group 2).
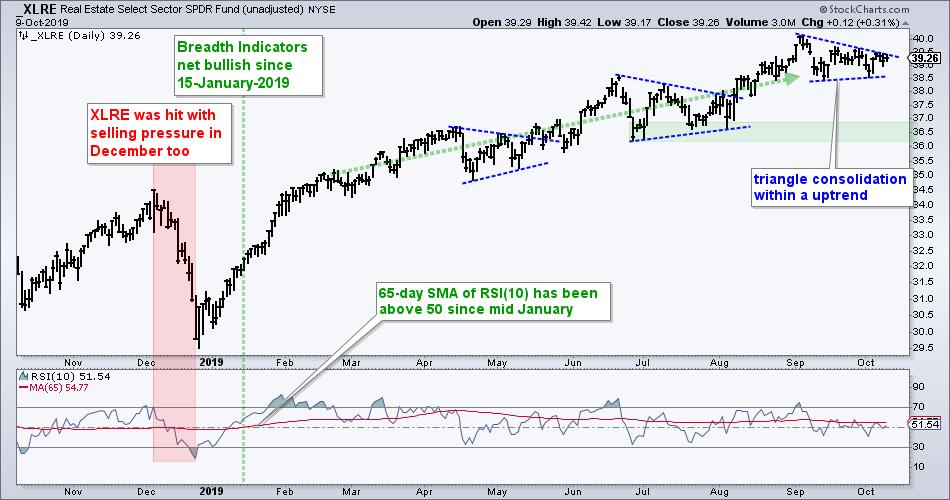
The Real Estate SPDR (XLRE) stalled with a triangle consolidation over the last few weeks. A consolidation within an uptrend is typically a bullish continuation pattern. Notice that XLRE is not even close to the early August low and still very near the early September high, which was a 52-week high. It is still holding up.
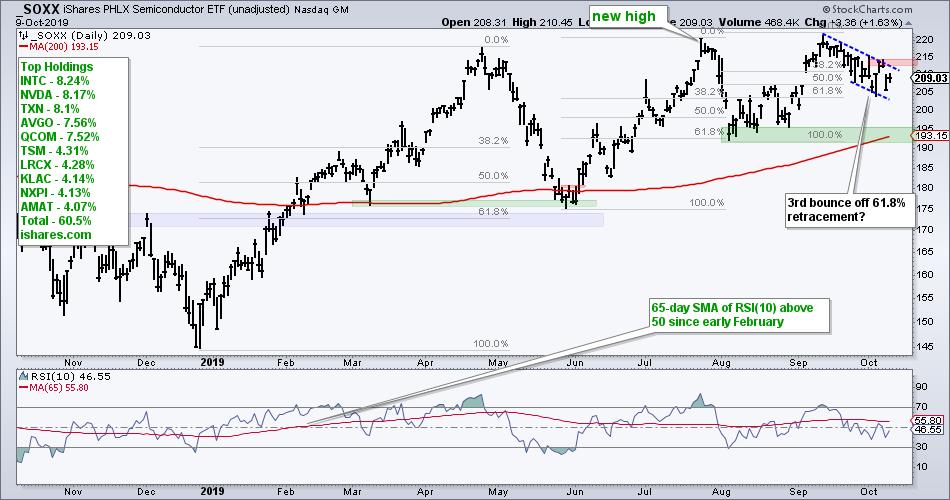
The Semiconductor ETF (SOXX) hit a new intraday high in mid September and then fell back with a falling flag. The ETF remains well above the early August low and is holding up better than its tech-related peers. A falling flag is a bullish continuation pattern, but the first reversal attempt failed as the ETF gave back the gains from its bounce last Thursday-Friday. Thus, we are still waiting for the breakout at 215 to reverse the short-term slide.
------------------------------------------------------------
Group 3: Consolidating or Topping?
SPY, QQQ, MTUM, XLK, XLY, XLF, XLI, XLC, TAN, IHI, HYG
Now we get to the group that holds the key to the broad market environment, which remains bullish because of large-caps. SPY, QQQ and the five offensive SPDRs are either consolidating or topping. Technically, a Double Top is not confirmed until a break below the intermittent low, which is the early August low in most cases. Technically, the long-term trend is up after a higher high and in the absence of a lower low. Technically, the long-term trend is up when price is above the 200-day SMA, the 20-day SMA is above the 200-day SMA and the 65-day SMA of RSI(10) is above 50. Consider these factors when looking at charts in this group.
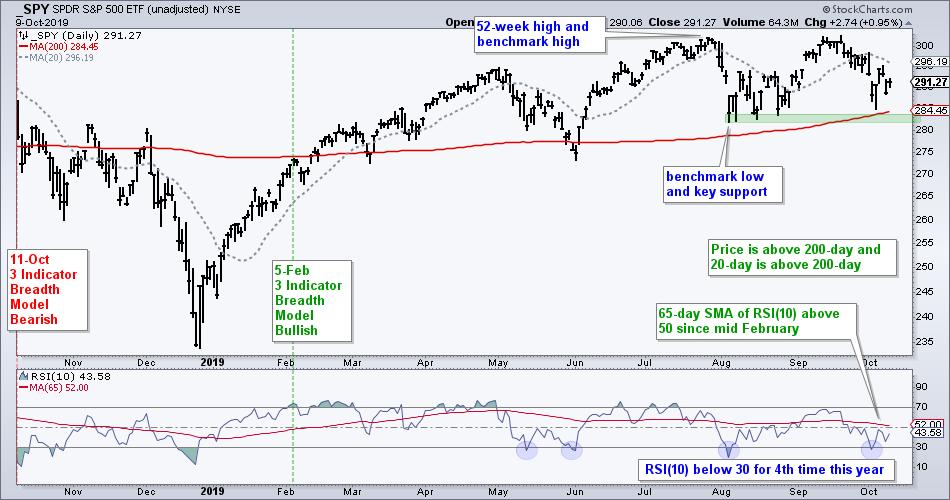
The first chart shows SPY hitting a new high in late July and trading above its August low (green support zone). Price is above the 200-day SMA, the 20-day SMA is above the 200-day SMA and the 65-day SMA of RSI(10) is above 50. So far, SPY remains in an uptrend because this uptrend has yet to be proven other wise. Sure, there are a zillion possibilities out there, such as negative divergences, but evidence for a downtrend is still lacking. A close below 282 would prove the uptrend otherwise.
The next chart shows QQQ with a potential triangle taking shape after the July high. The August-October lows mark a clear support zone and a close below 179 would reverse the uptrend. QQQ would then have a lower low to go with its lower high.
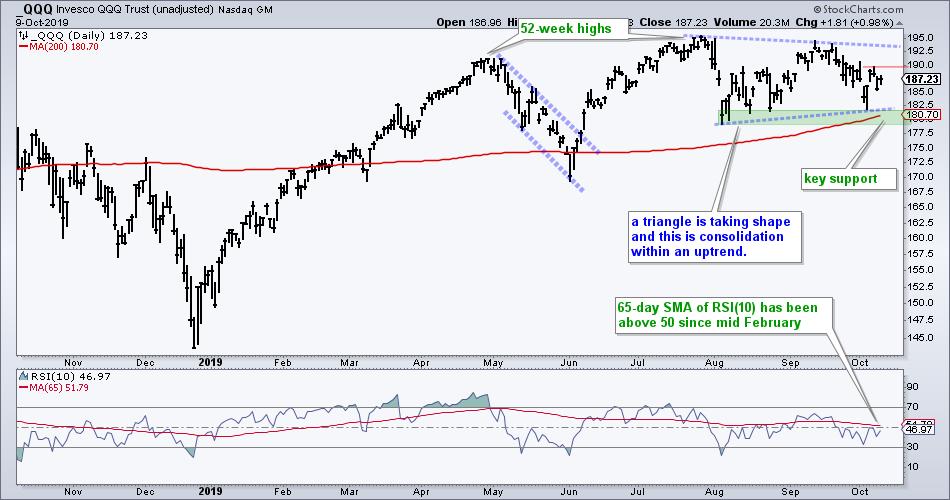
The swing within the triangle is also down with short-term resistance marked at 190. At this point, we have yet to see follow through to last Friday's gap-surge. A break above 190 would provide said follow through and increase the chances of a triangle breakout.
The High-Yield Bond ETF (HYG) represents junk bonds, which act more like stocks and are sensitive to the economic outlook, as well as credit conditions. Their yields rise, and prices fall, when conditions deteriorate and investors demand more return for risk. As you can see from the chart below, HYG looks more like SPY than TLT. A Double Top is also in the making with key support set at 84. Notice that the 65-day SMA of RSI(10) dipped below 50 twice since August. HYT looks weaker than SPY overall and a break below support would be negative for more than just junk bonds.
The next chart shows the five offensive sector SPDRs. They are the "offensive" sectors because they represent key areas of the economy and stock market. Technology is the biggest sector and has the high beta stocks (sans biotechs). Consumer Discretionary has the most economically sensitive stocks. Industrials represents the backbone of the economy. Communication Services captures the big internet/media titans (GOOGL, FB, DIS). Finance represents the financial system with big banks, regional banks and brokers.
There are two levels to watch going forward. First and foremost, all five recorded new highs over the last few months. Second, all five remain above their August lows (green lines). Technically, they are still in uptrends. The Comm Services SPDR (XLC) tested its August low and is the least strong. The Industrials SPDR (XLI) is just below its 200-day SMA and is also a laggard in the group. The trouble starts when/if three of the five break their August lows. Such moves would forge lower lows, break key supports and shift the balance of power within the S&P 500.
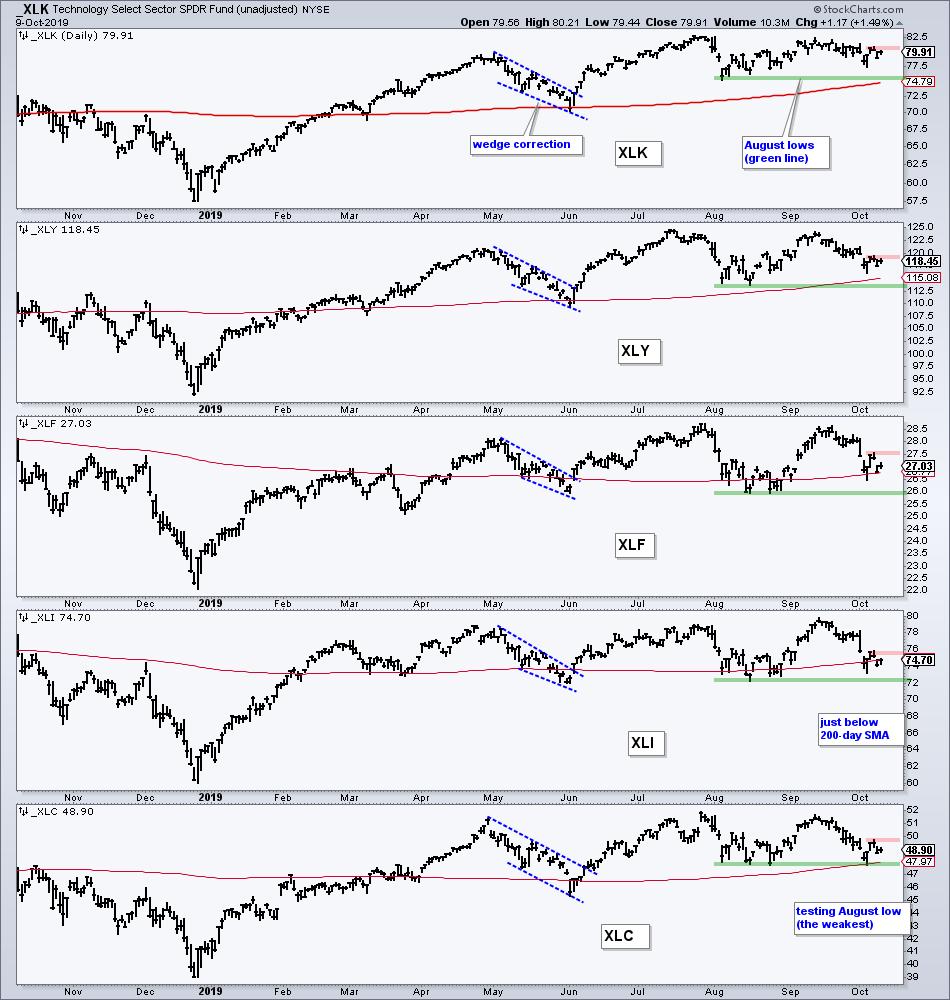
The red lines mark the highs from Friday and Monday. Stocks forged a reversal last Thursday and surged on Friday. On a closing basis, these gains were wiped out on Tuesday in three of the five sectors as they closed below last week's closing low (XLY, XLF and XLI). This immediate decline and the inability to follow through is negative. Follow through and a break above these red lines is needed to revive the bulls.
------------------------------------------------------------
Group 4: Relatively New Downtrends
FINX, IGV, IPAY, SKYY, HACK, FDN
Group 4 features the tech-related ETFs. Not because they are in the same sector, but because they all broke their August lows. These are the benchmark lows that SPY and XLK are still holding. Not only did this group break their August lows, but they also barely bounced off these lows and lagged badly in mid September. HACK and FDN are by far the weakest and well below their 200-day SMAs.
The FinTech ETF (FINX) closed below its August low last week (2-Oct), but bounced on Thursday-Friday. Even though there is support extending back to the May-June lows and price is above the 200-day, there is clearly a downtrend in play since late August and the 65-day SMA of RSI(10) is below 50. This is what is happening right now.
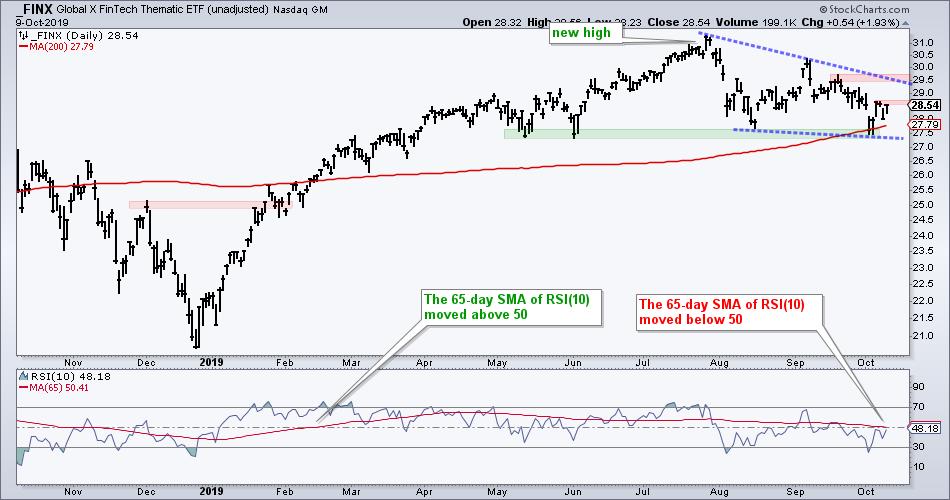
Now to the "possibilities". A falling wedge could be taking shape with the mid September high marking resistance. Yes, the falling wedge is typically a bullish continuation pattern, but the immediate trend is down as long as the wedge falls. As with the sector SPDRs above, short-term resistance is set at the Friday-Monday high. A breakout here would provide the early bullish signal, especially if we see the offensive sectors breaking short-term resistance too.
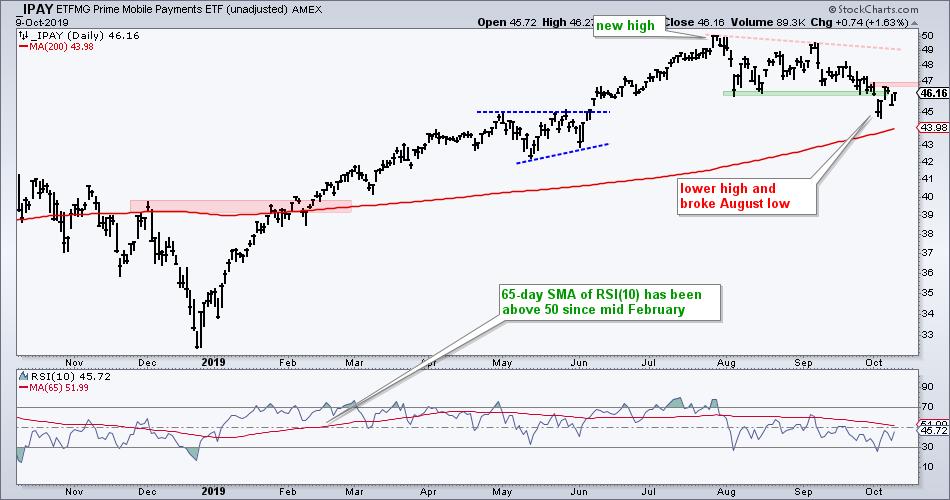
The Mobile Payments ETF (IPAY) broke the August low and also rebounded. Nevertheless, the lower high and lower low are in play to define the downtrend right now. Chart analysis is not always clear cut because price is above the 200-day SMA and the 65-day SMA of RSI(10) is also above 50. As with FINX, I would watch for follow through to last week's two-day reversal and a break above 47 before considering a return to the bullish camp.
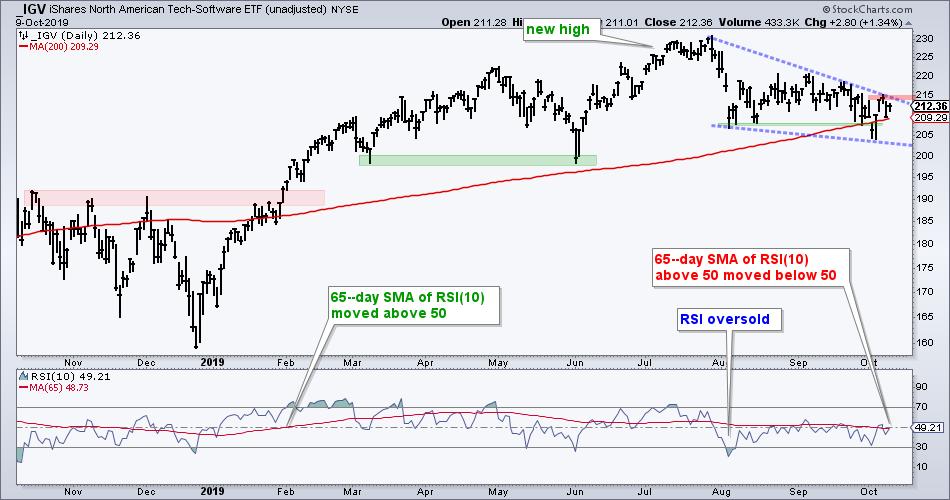
The Software ETF (IGV) broke the August low last week and also rebounded. A falling wedge is taking shape over the last two months and a break above 216 is needed to reverse this decline.
------------------------------------------------------------
Group 5: Multi-month Downtrends or Ranges
MDY, IWM, IJR, XLV, KRE, KBE, REM
Now we get into the really weak parts of the market. These are ETFs that have either worked their way lower for months or traded in ranges. Either way, they are not leaders and their charts are not healthy. The S&P MidCap 400 SPDR (MDY), S&P SmallCap 600 SPDR (IJR) and Russell 2000 ETF (IWM) feature in this group. On a pure numbers basis, this suggest that there are more stocks in downtrends than uptrends in the broader market. Large-caps remain in group 3 and holding up for now, They represent 500 stocks at most, but some 80% of the total US market cap.
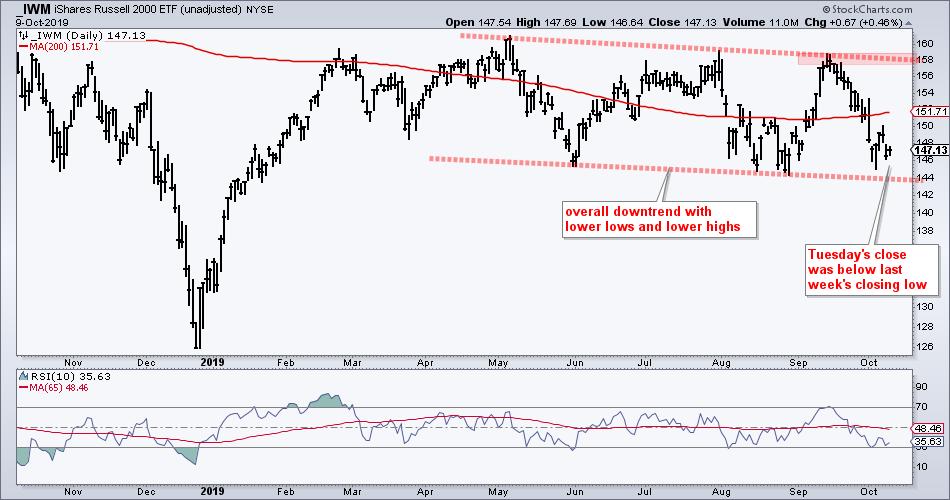
The chart below shows IWM with a series of lower lows and lower highs since April. The 200-day SMA has been of little value this year as price crossed at least 18 times. Regardless, we can see a clear downtrend in place for six months. Notice that Tuesday's close was below last week's closing low as IWM gave back all of the Thursday-Friday bounce (closing prices).
------------------------------------------------------------
Bottom Line
Large-caps are holding up the broader market because the majority of stocks and equity-related ETFs are in downtrends of some sort. Should large-caps break down (see group 3), I would expect correlations to rise further and even the leaders could get hit. Yes, I am talking Utilities, REITs and Staples. Bonds and gold are separate entities.
We already saw a thinning of the leader group with the Aerospace & Defense ETF (ITA) and Insurance ETF (KIE) falling over the last few weeks and moving to group 2. These two are still stock-related ETFs and not immune to broad market weakness. This is why I would monitor the broad market environment closely in the coming days/weeks.
------------------------------------------------------------
Choose a Strategy, Develop a Plan and Follow a Process
Arthur Hill, CMT
Chief Technical Strategist, TrendInvestorPro.com
Author, Define the Trend and Trade the Trend
Want to stay up to date with Arthur's latest market insights?
– Follow @ArthurHill on Twitter


