
The S&P 500 and Nasdaq 100 remain in good shape, the Russell 2000 remains in bad shape and the S&P MidCap 400 is caught in the middle. I am not going to read too much into relative and absolute weakness in small-caps because the Russell 2000 is always overreacting. We need to focus on the older, and more mature, S&P 500 when making a broad market assessment.
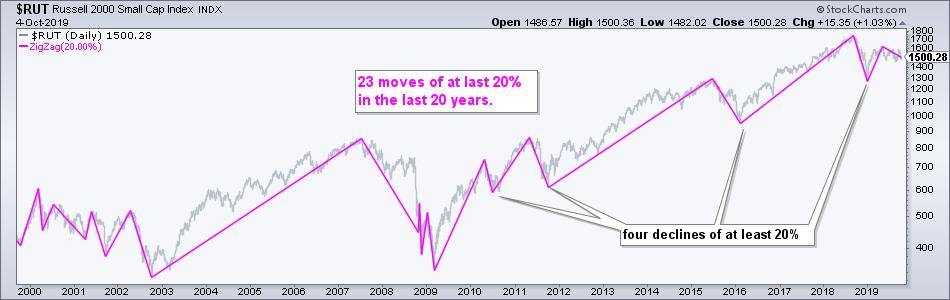
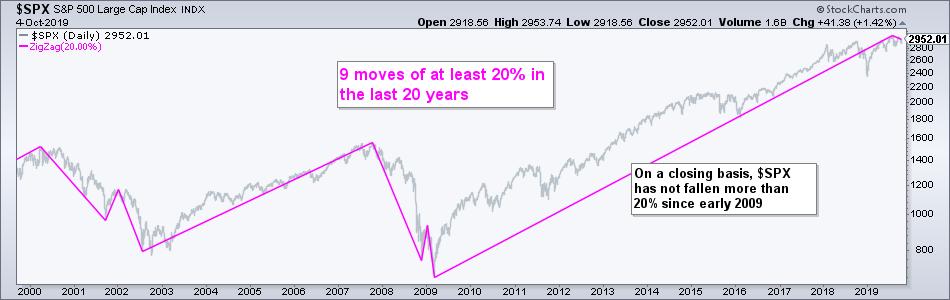
The charts below show the Russell 2000 and the S&P 500 with the Zigzag indicator set at 20% (pink lines). These lines filter out moves less than 20% by zigging and zagging only when the index moves at least 20%. Note that I do not count the last move in the Zigzag because it is still a work in progress. This is a 100% hindsight indicator.
The first chart shows the Russell 2000 with 23 moves that were 20% or more in the last 20 years, which averages out to at least one per year. There have also been four declines of at least 20% since the 2009 low.
The next chart shows the S&P 500 with 9 moves that were 20% or more in the last 20 years, a lot fewer than the Russell 2000. Note that the last 20+ percent decline was in early 2009 and the S&P 500 has yet to fall more than 20% in the last ten years (closing prices).
At this point, the S&P 500 is less than 3% from its all time high, which was in July 2019. The Russell 2000 is around 16% below its all time high, which was way back in August 2018. Small-caps have been dragging their feet for well over a year. Nevertheless, the S&P 500 is still in an uptrend and still close to an all time high.
As the charts below show, the S&P 500 and its key sectors remain in bull mode. As a Dow Theorist and trend-follower kind of guy, I think the best we can do is accept the current trend until it is proven otherwise. Today's report will show the bullish evidence and the key levels to watch that would prove the bullish case otherwise.
------------------------------------------------------------
SPY and QQQ Affirm Key Support
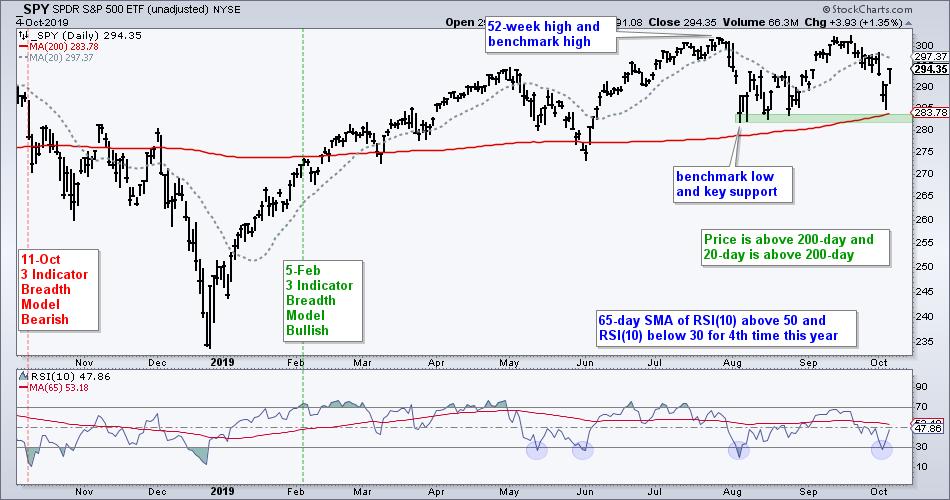
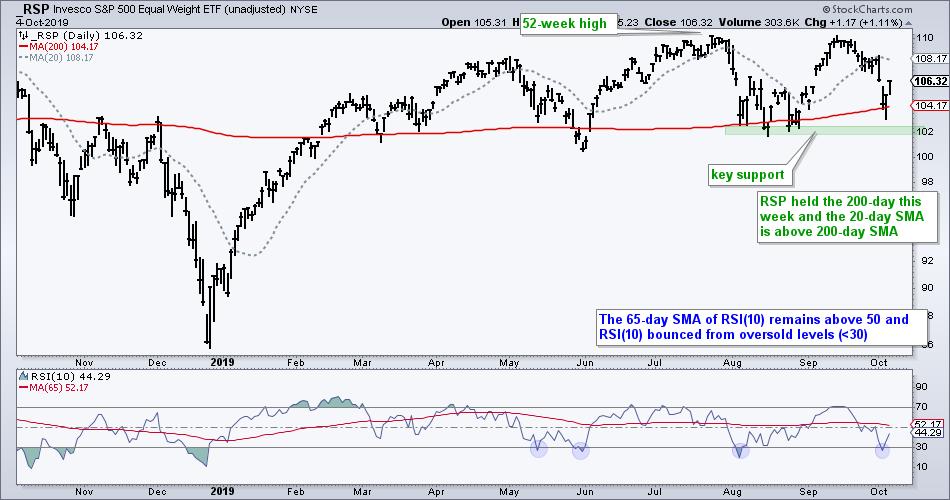
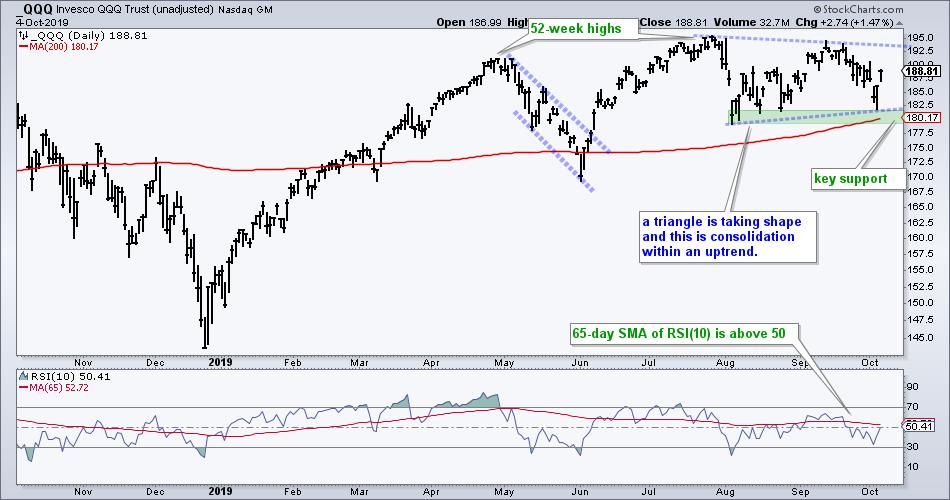
The long-term trend for the S&P 500 remains up and stocks got an oversold bounce over the last two days. As the charts below show, SPY, RSP and QQQ all held their August lows and rising 200-day SMAs. In addition, the 65-day SMA of RSI(10) remains positive. The long-term trends are up until proven otherwise and I will be watching these three items for signs of a trend reversal.
With a four day reversal this week and higher low from August to September, QQQ is tracing out a triangle within an uptrend. This bounces reinforces support in the 180 area and a consolidation within an uptrend is typically a bullish continuation pattern.
------------------------------------------------------------
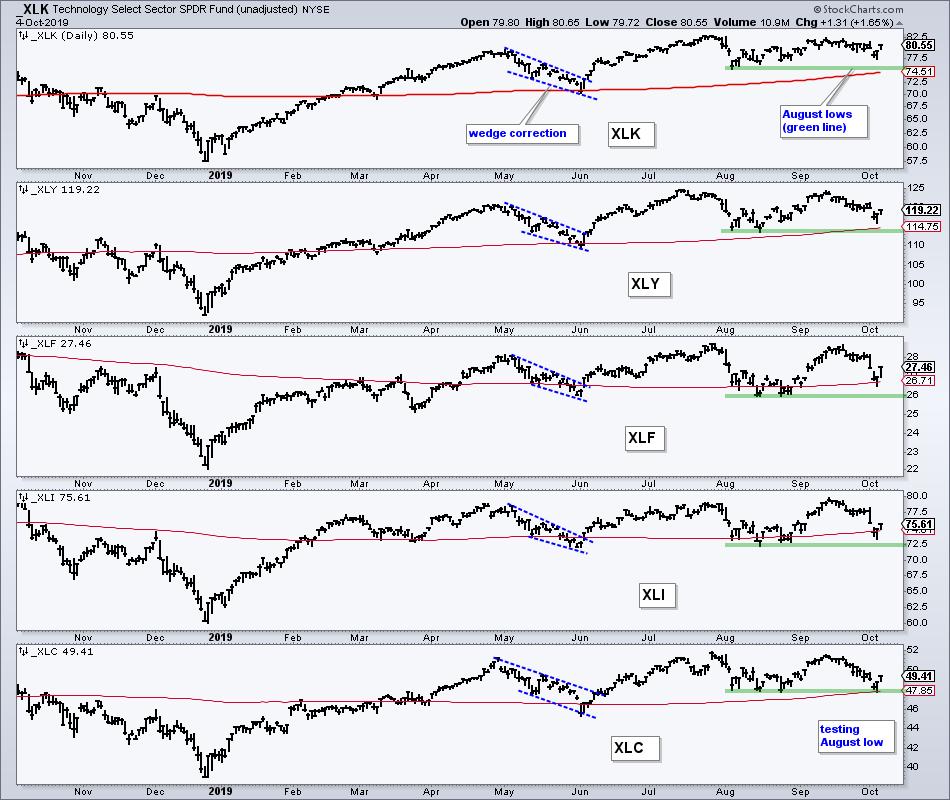
Five Offensive Sectors Hold
The Thursday-Friday bounce also affirmed the importance of the August lows for the five offensive sectors (Technology, Consumer Discretionary, Finance, Industrials and Communication Services). Together, these five sectors account for 64.6% of the S&P 500. All five are also above their 200-day SMAs. I would not become concerned with the broad market environment unless three of the five break their August lows.
Looking for leading sector and industry group ETFs? Check out the ETF Ranking and Grouping Report.
------------------------------------------------------------
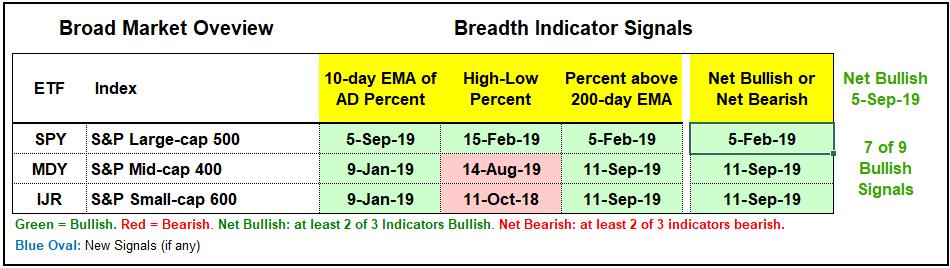
Breadth Strongest in S&P 500
The Index Breadth Model remains bullish with the S&P 500 leading the charge since February 5th. A big bad bear market is pretty much impossible until the S&P 500 flips bearish. The institutions are most active in large-caps (S&P 500) and we have yet to see any serious weakness in the two long-term indicators (S&P 500 High-Low% ($SPXHLP) and S&P 500 %Above 200-day EMA ($GT200SPX). These indicators may be "less strong", but we need actual weakness before considering them bearish.
------------------------------------------------------------
Short-term Oversold on Wednesday
The 10-day EMAs of Advance-Decline Percent fell below -20% on October 2nd (Wednesday) to create a short-term oversold condition, similar to what we saw in early August and early June (blue ovals). Note that the 10-day EMA of S&P 500 AD Percent ($SPXADP) moved below -30% on October 2nd, but mid-caps and small-caps held up.
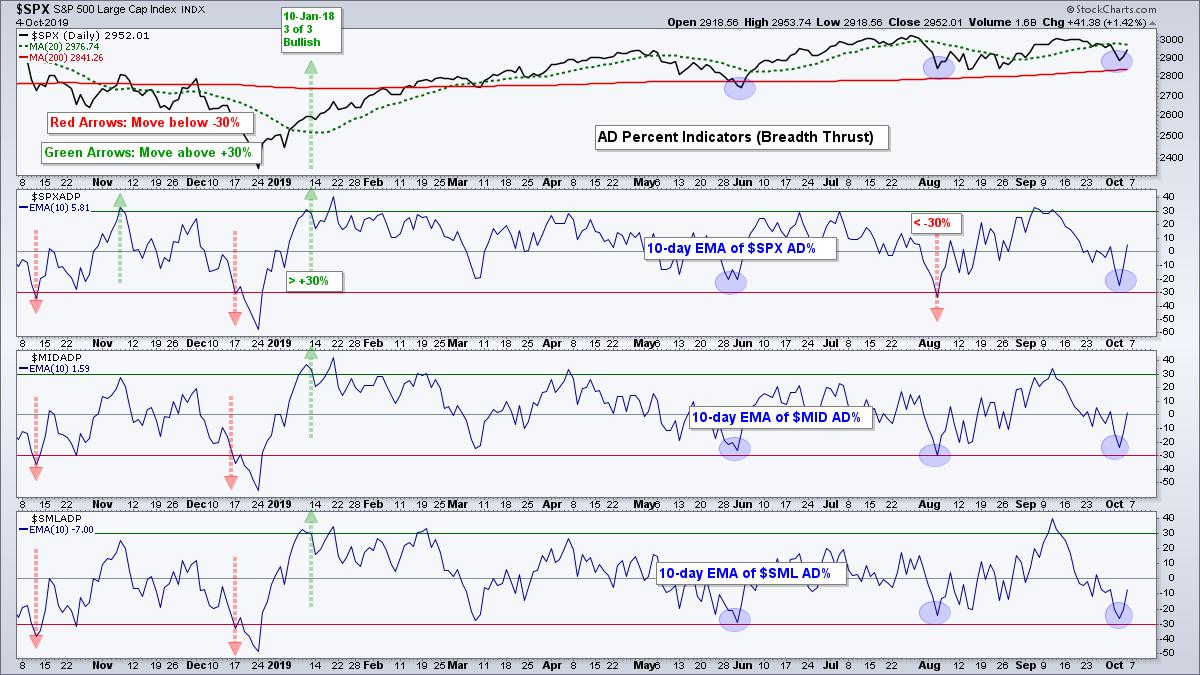
Oversold is a fine line. Oversold charts often look ugly short-term, but we cannot forget the bigger picture. Turning bearish on short-term dips is often a result of recency bias, which we are all guilty of at some point. Wednesday's oversold readings paved the way for the bounce on Thursday and Friday. More importantly, all three indicators did not fall hard enough to trigger bearish signals.
------------------------------------------------------------
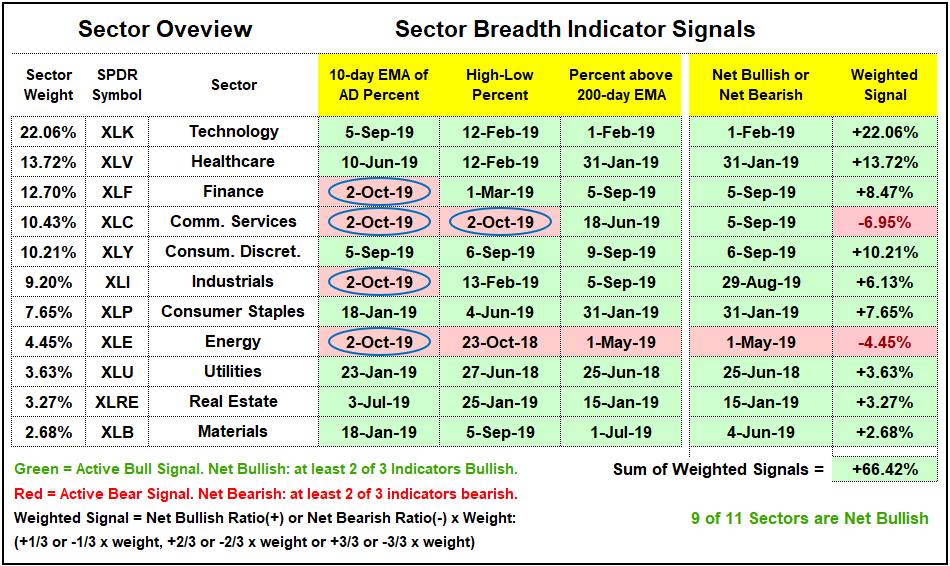
Some Hits to Sector Breadth
The Sector Breadth Model remains firmly bullish, but selling pressure over the last couple weeks triggered some bearish breadth thrusts (XLF, XLC, XLI and XLE). The 10-day EMA of Advance-Decline Percent is the most sensitive of the three breadth indicators. This is why I balance it out with High-Low Percent and the Percentage of Stocks Above the 200-day EMA. The Comm Services SPDR (XLC) is now net bearish because a second indicator, High-Low Percent, exceeded -10% this week. The Industrials SPDR (XLI) and Finance SPDR (XLF) remain net bullish because two of the three indicators are still on active bullish signals.
------------------------------------------------------------
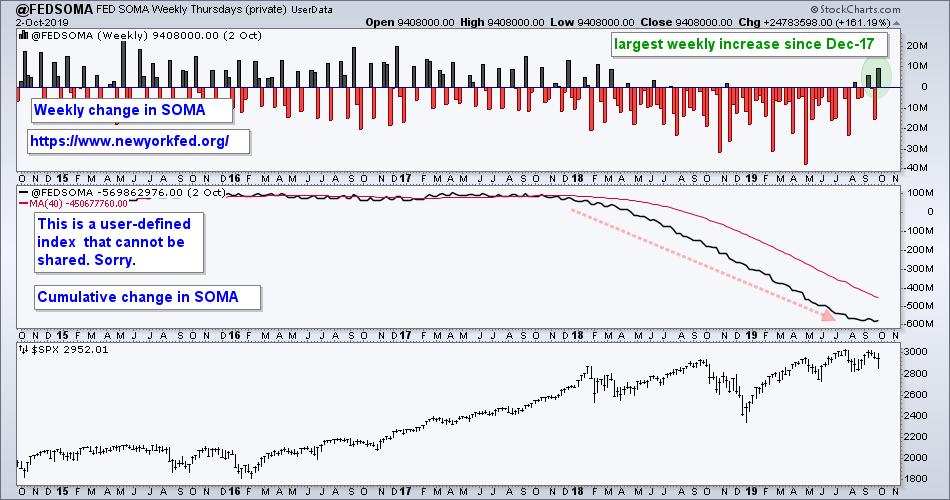
SOMA Rises
While I never read the FOMC statement or analysis of Fed speak, I do keep an eye on the weekly System Open Market Account (SOMA), which you can read about at the NY Fed website. An increase in the Fed's balance sheet is generally viewed as bullish for stocks (don't fight the Fed). Notice that SOMA fell from December 2017 until September 2019 and the S&P 500 was largely flat. This may be changing because the weekly change in SOMA was positive two of the last four weeks. Moreover, note that last week's increase was the largest since December 2017.
------------------------------------------------------------
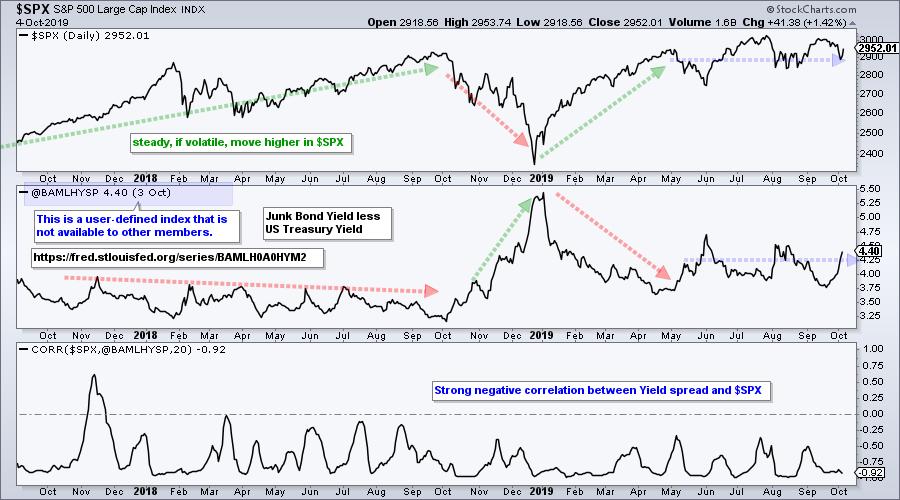
Junk Bond Spread Ticks Up
The next chart shows the spread between junk bond yields and Treasury bond yields (source: St Louis Fed). Junk bonds are the riskiest bonds with the highest yields, while Treasury bonds are the safest with the lowest yields. The spread represents credit conditions in the fixed income market, which in turn reflects economic conditions. A low and falling spread is positive for stocks, while a high and rising spread is negative. The red, green and blue lines show the correlations with the S&P 500. The spread ticked up the recently and I would become concerned if it moves above 5.
------------------------------------------------------------
Bottom Line
Perhaps the Fed expanded its balance sheet because of what it saw in the credit markets. Does the bump in the balance sheet negate the uptick in the yield spread? Who knows? Dissecting the Fed and economics is a run down the rabbit hole. There are a zillion factors influencing stocks and we cannot expect to know key factors at this stage of the cycle. Actually, we can. Price is always the single most important factor and I would put breadth a close second. You know what I will be watching.
It is a bull market environment with large-caps leading the way. Even though the Russell 2000 has been trending lower for months and lagging, some individual small-cap stocks are performing well. I am also seeing pockets of weakness within the large-cap universe, especially when we look at the equal-weight sector ETFs. Nevertheless, I take a weight of the evidence approach and the pockets of strength still outweigh the pockets of weakness. These pockets of weakness, however, dilute the pockets of strength and slow the uptrend in the S&P 500. It is a stock picker's market. See articles links below....
------------------------------------------------------------
This Week on Art's Charts
Saturday - 5-Oct: Semiconductor ETFs Hold Up and Lead Tech - Plus 7 Semiconductor Stock Setups
Thursday - 3-Oct: Ranking and Grouping ETFs - SPY Consolidates, GLD Flies the Flag and SOXX Holds Strong
Wednesday - 2-Oct: Some Key Equal-Weight Sectors are Under Pressure
Tuesday - 1-Oct: Follow Up to Sunday Setups - When is the Rationale Invalidated?
Choose a Strategy, Develop a Plan and Follow a Process
Arthur Hill, CMT
Chief Technical Strategist, TrendInvestorPro.com
Author, Define the Trend and Trade the Trend
Want to stay up to date with Arthur's latest market insights?
– Follow @ArthurHill on Twitter


