Big Banks Hold Big Breakouts and this Laggard May Play Catchup

Several finance-related ETFs and stocks broke out with big moves from early October to early November. Many of these then stalled over the last two weeks and this rest could be the pause that refreshes. Today we will look at performance for the finance-related ETFs and the bull flags taking shape in three banking stocks. Even though one of these stocks is lagging the others, it could be poised to play catch-up with a big breakout.
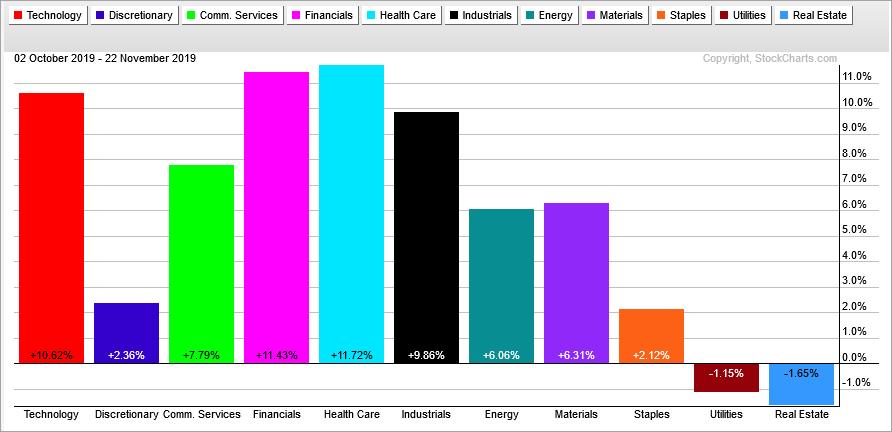
Finance and bank-related ETFs are leading. The S&P 500 SPDR is up sharply since October 2nd (37 trading days) with leadership coming from Healthcare (+11.72%), Finance (+11.43%), Technology (+10.62%) and Industrials (+9.86%). Though not shown on the PerfChart below, the Regional Bank ETF (KRE) and Bank SPDR (KBE) are also leading with 9.75% and 10.38% gains, respectively. This leadership means we want to be looking within the Finance sector and banking industry for bullish setups. KRE and KBE are featured in the ChartBook at TrendInvestorPro.com (subscription required).
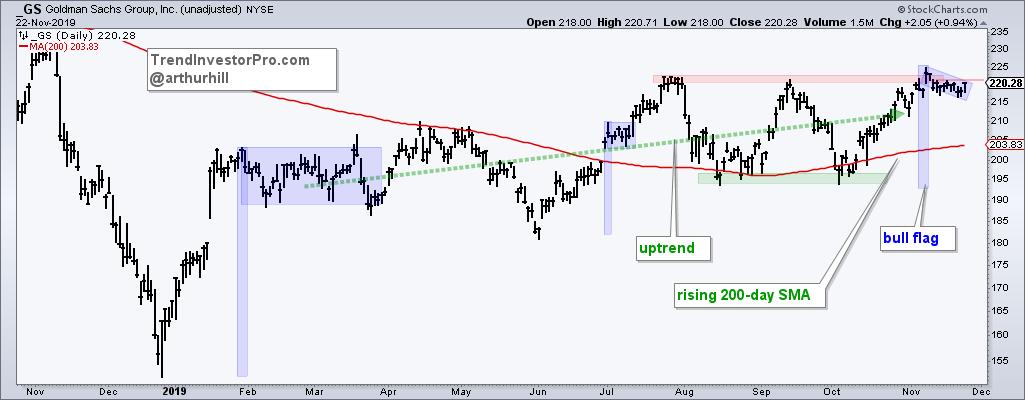
The next three charts show stocks with long-term uptrends and short-term bull flags. All three are trading above their rising 200-day SMAs. BAC and C hit new 52-week highs in November, while GS recorded a new high for 2019. GS was also featured in Saturday's report on TrendInvestorPro.com (subscription required).
The first chart shows Bank of America (BAC) with three bull flags on the chart. The first two failed and the third one is currently in play. I am showing the two failures for study purposes and to set realistic expectations going forward. As with most patterns, bull flags are not layups. They are more like three pointers (higher risk and higher reward). The key is to study prior setups, plan your trade before taking the trade and implement that plan with a clear process for follow up.
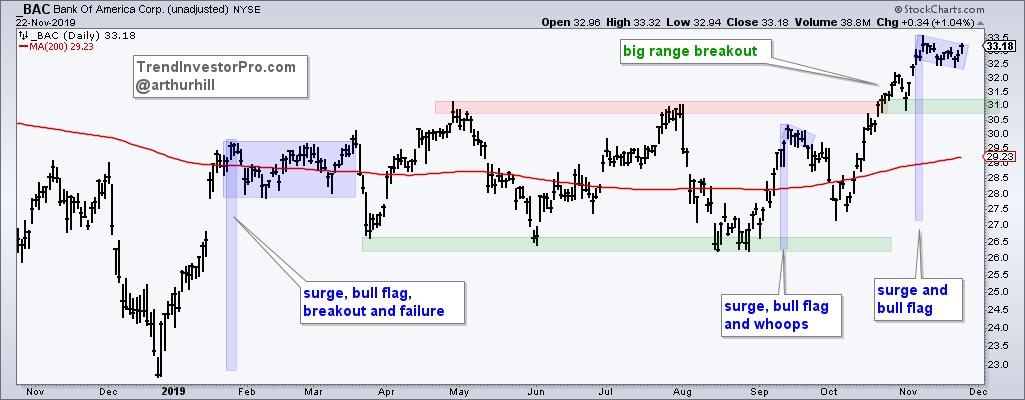
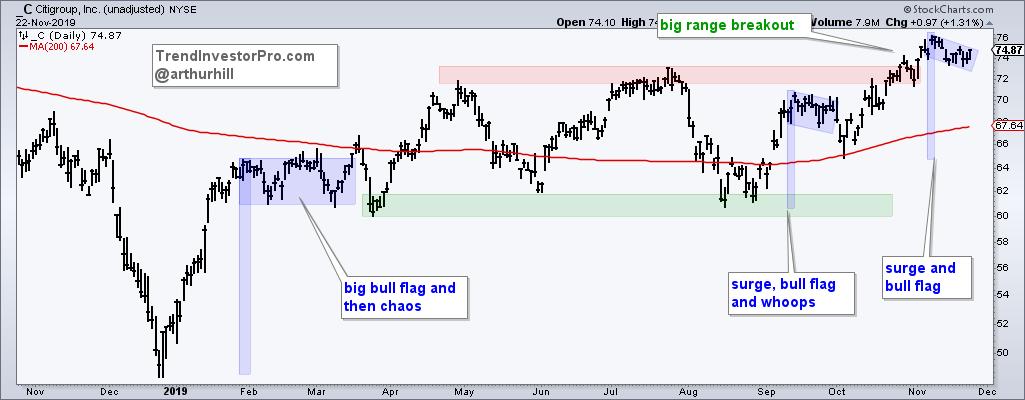
On the charts above, BAC and C surged to new highs in early November and then edged lower with falling flags. Both were overbought in early November and these flags worked off the overbought conditions. In traditional technical analysis, a falling flag is a bullish continuation pattern and a breakout would signal a continuation of the prior advance. The low of the flag can be used to set a stop-loss and chartists should consider taking partial profits (when possible) to ensure a breakeven trade.
The next chart shows Goldman Sachs (GS) trading near its July-September highs. Technically, a higher high formed in early November after the 13.5% surge. The falling flag alleviates overbought conditions and paves the way for the next move. Note that a flag breakout would also pave the way for a bigger breakout (red resistance zone). GS is lagging the other two because it remains near the July-September highs, but a breakout could turn it into a leader again.
Looking for ETFs or stocks poised to break out and lead as the bull market broadens? Check out TrendInvestorPro.com, home of objective, systematic and actionable analysis from Arthur Hill, CMT.
Geared towards the weekend trader or investor, TrendInvestorPro offers:
- A Unique Grouping/Ranking System for 60 Core ETFs (Thursdays)
- A ChartBook with annotated charts for 60 core ETFs (Thursdays and Saturdays)
- Market timing models and broad market commentary (Fridays)
- Stock setups and chart analysis (Saturdays)
- Weekly video analysis and commentary (Saturdays)