 Looking for an indicator to find stocks and ETFs that held up the best last week? Look no further. Today I will show how to use a classic indicator to quantify last week's decline and rank names by their retracements.
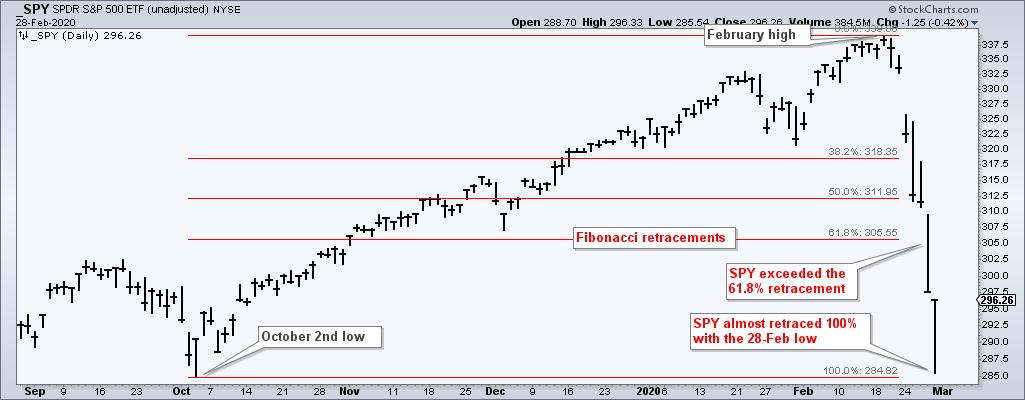
In general, stocks bottomed in early October and moved higher into January and February. The S&P 500 SPDR (SPY), which serves as the benchmark, bottomed on October 2nd and peaked on February 19th. SPY then fell sharply the last six days and retraced around 80% of this advance. Stocks and ETFs that retraced less are holding up better than SPY, and these are the names I want on my watchlist. Stocks and ETFs that retraced more are performing worse, and do not make the cut.
Visually, we can estimate retracements by using the Fibonacci retracements tool. As the chart above shows, SPY exceeded the 61.8% retracement with last week's decline and almost retraced 100% with Friday's intraday low. Friday's close is between the 61.8% and 100% retracement levels, but we do not know the exact retracement when using the Fibonacci retracements tool.
Enter Williams %R. Chartists can use William %R to find an exact retracement over a given period, 102 days in this case. This indicator quantifies the position of the close relative to the high-low range over a given period. Keep in mind that the range is based on the intraday high and low. Williams %R is the difference between the range high and the close divided by the high-low range. This quotient is then multiplied by -100, which is why the indicator ranges from 0 to -100.
Here is the example from the chart below. Since October 2nd (102 days), the range high for SPY is 339.08 and the range low is 284.82 (range = 54.26). The difference between the range high and the close is 42.82 (current position). Williams %R is the current position divided by the range (42.82/54.26 = 78.92), and then multiplied by -100 (78.92 x -100 = -78.92).
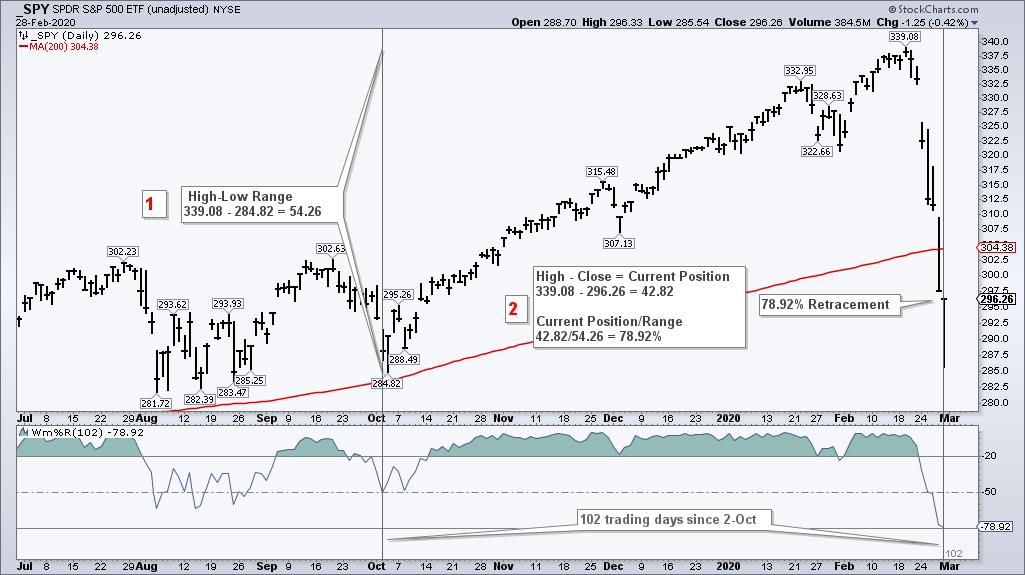
The indicator window shows 102-day Williams %R at -78.92, which means SPY retraced 78.92% of the October-February advance. That's a lot. Stocks and ETFs with higher values for Williams %R held up better, while stocks and ETFs with lower values fared worse.
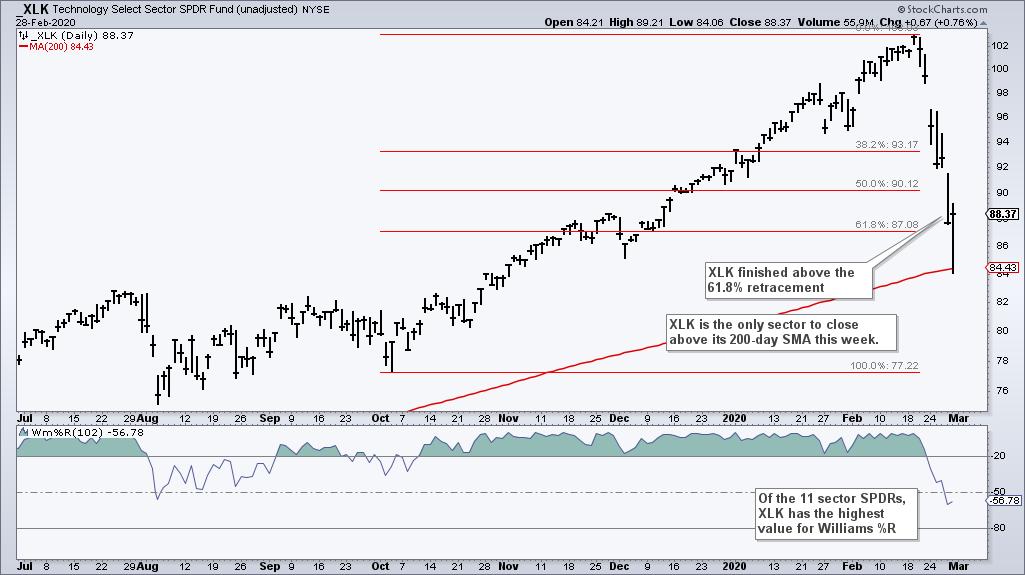
One sector stands out when comparing the 102-day Williams %R values. Of the eleven sector SPDRs, the Technology SPDR (XLK) has the highest value for Williams %R (-56.78), which means it has the shallowest retracement and held up the best. XLK also finished the week above the 61.2% retracement and is the only sector to finish above the 200-day SMA (unadjusted data).
The accompanying video includes a review of Saturday's commentary showing two indicators that triggered rare oversold readings for the S&P 500. Click here the Youtube video.
This weekend at TrendInvestorPro.com I back-tested a mean-reversion strategy for SPY using RSI(14) and a 10+ percent decline. In addition, I highlighted six ETFs that held up exceptionally well this past week with shallow retracements. There is also a weekend video, ChartBook with annotated charts and more.
Click here to take your analysis process to the next level!
-------------------------------------
Choose a Strategy, Develop a Plan and Follow a Process
Arthur Hill, CMT
Chief Technical Strategist, TrendInvestorPro.com
Author, Define the Trend and Trade the Trend
Want to stay up to date with Arthur's latest market insights?
– Follow @ArthurHill on Twitter


