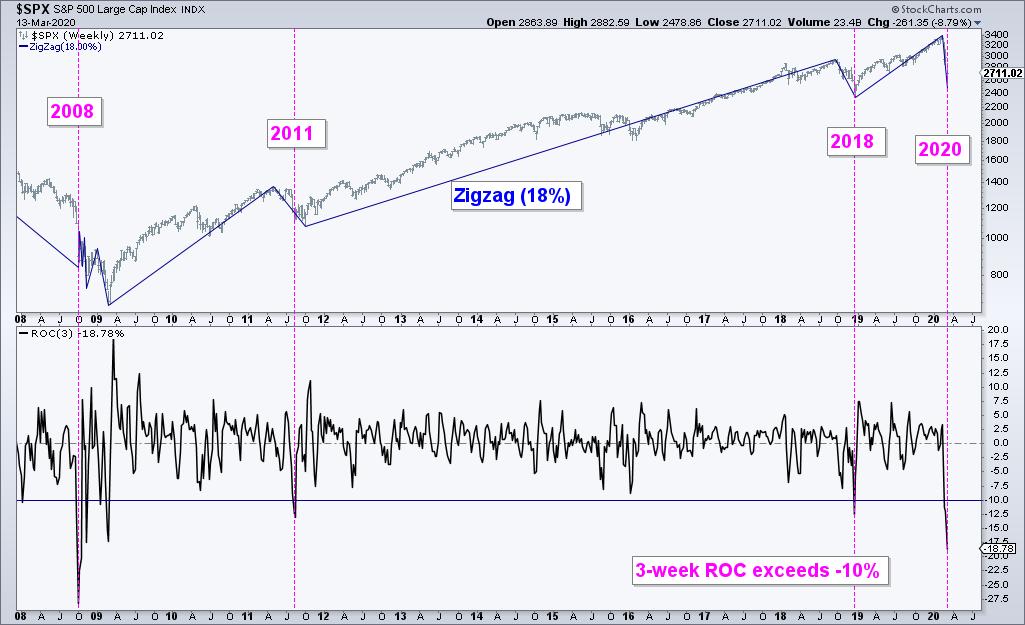
 The S&P 500 moved from a 52-week high to a 52-week low with lightening speed over the last three weeks. To capture the sharpness of this decline, I am showing a chart with the 3-week Rate-of-Change in the indicator window. At -18.78%, this is the deepest three week decline since October 2008 and the third time the indicator has dipped below -10% since the March 2009 low. The chart also shows the Zigzag (18) to focus only on swings that are 18% or more. This is the third 18% decline since the March 2009 low.
Judging from the steepness of the decline and the 9.29% surge on Friday, the 2011 period could offer a road map to consider going forward. The chart below shows the S&P 500 falling 16.77% in 11 days in July-August 2011. Nine weeks of hair raising volatility followed this plunge as the index went nowhere fast. Actually, I did not have any hair left by the time this period ended.
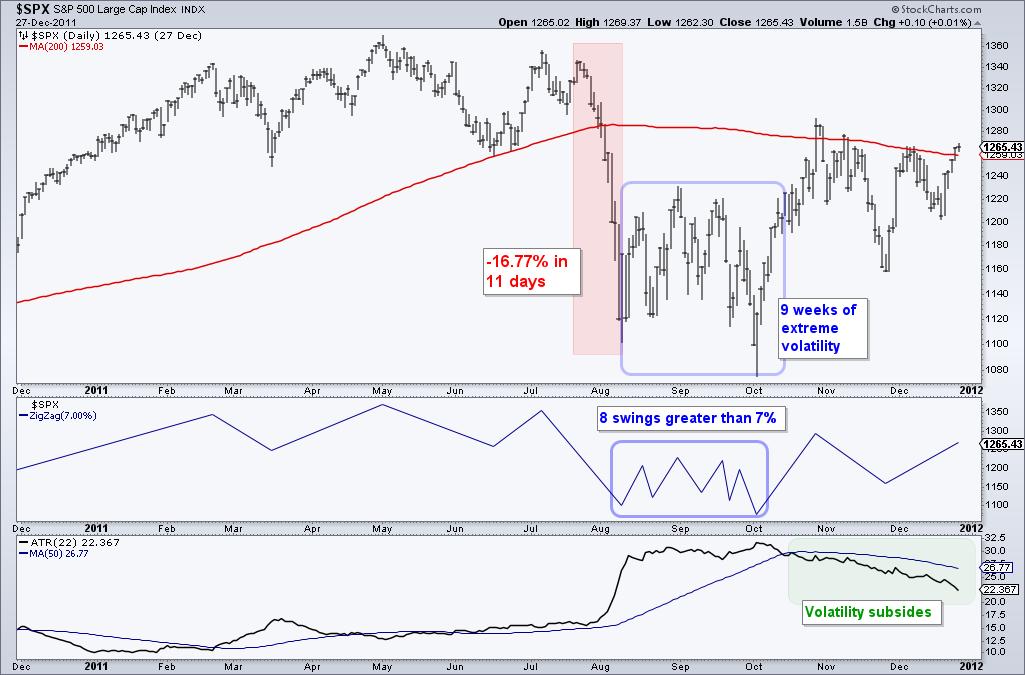
The first indicator window shows the S&P 500 Zigzag (7) to highlight swings that are 7% or more. Notice that there were eight such swings during this nine week period. The second indicator shows ATR(22) edging higher in June-July and turning up sharply in August. This confirms the increase in volatility. The market did not settle down until ATR(22) moved below its 50-day SMA in mid October.
Given the March 2020 crash and the 9.29% surge on Friday, it looks like we are moving into a period of extreme volatility (at best). At worst, we are in a bear market and negative outcomes are more likely in bear markets. Note that the broad market environment turned bearish in late February when the Index and Sector Breadth models turned majority bearish at TrendInvestorPro.com.
This weekend at TrendInvestorPro.com I went back 50 years to analyze four bear markets and two crashes (with video). History does not exactly repeat itself, but it often rhymes and we can learn from past price action. In this post and video, I will outline what we can expect after a crash and in a bear market. In addition, I will show some bearish setups to watch for.
Click here to take your analysis process to the next level!
-------------------------------
Choose a Strategy, Develop a Plan and Follow a Process
Arthur Hill, CMT
Chief Technical Strategist, TrendInvestorPro.com
Author, Define the Trend and Trade the Trend
Want to stay up to date with Arthur's latest market insights?
– Follow @ArthurHill on Twitter


