Archived News
RRG Charts2w ago

S&P & Tech Stocks: Will Seasonality Lead to More Pain?
Sector rotation is shaping the S&P 500's next big move! In this exclusive StockCharts video, Julius analyzes SPY support levels, key sector trends, and the latest seasonal patterns—which indicate further downside for Technology stocks Read More
A View From The Floor2w ago

Stocks In Focus: Three Charts to Watch
This week, we get back to earnings and, sadly, the pickings are slim. Given these turbulent times, we have two Consumer Staples stocks to examine — Lamb Weston (LW) and Conagra (CAG) Read More
DecisionPoint2w ago

Silver Cross Index Tops Beneath Signal Line on SPY
One of the indicators that Carl Swenlin developed is the Silver Cross Index. It is one of the best participation indicators out there! Here's how it works: We consider a positive 20/50-day EMA crossover a "Silver Cross". If a stock has a Silver Cross it has a bullish bias Read More
The Mindful Investor2w ago

Bear Flag Alert - Downside S&P 500 Target Update
Friday's overheated inflation data appears to have initiated a new downward leg for the major equity averages. This could mean a confirmed bear flag pattern for the S&P 500, and potentially much further lows before this corrective period is complete Read More
Art's Charts2w ago

Performance Profile Paints Different Pictures for Commodity and Equity ETFs
The performance profile for 2025 says a lot about the state of the market. Commodity-related ETFs are leading, non-cyclical equity ETFs are holding up the best and cyclical names are performing the worst. Clearly, this is not a positive picture for the stock market Read More
ChartWatchers2w ago

Unveiling Market Trends: What's Triggering a Midweek Bearish Shift?
Wednesday's stock market price action revealed a caution sign, and with it, any hope that rose from Monday's price action just got buried. The Tech sector sold off, with the Nasdaq Composite ($COMPQ) falling over 2%. The chart of $COMPQ indicated hesitation Read More
The Mindful Investor2w ago
Three Growth Stocks Testing the Ultimate Trend Barometer
After a blistering snapback rally over last the week, a number of the Magnificent 7 stocks are actively testing their 200-day moving averages Read More
ChartWatchers2w ago

This Precious Metal is On the Verge of a Massive Breakout. Here's How to Catch It!
Gold at $3,100 and silver at $50? That might've sounded wild a year or two ago, but it's now the upper trajectory some analysts are eyeing Read More
Members Only
Martin Pring's Market Roundup2w ago
Is It Time to Buy Tesla?
Recently, there have been horror stories about individual Tesla owners being harassed and dealers being vandalized, all because people have decided they don't like Elon Musk or his recent DOGE actions Read More
Stock Talk with Joe Rabil2w ago

Master Multi-Timeframe Analysis to Find Winning Trades!
In this exclusive StockCharts video, Joe shares how to use multi-timeframe analysis — Monthly, Weekly, and Daily charts — to find the best stock market opportunities. See how Joe uses StockCharts tools to create confluence across timeframes and spot key levels Read More
Trading Places with Tom Bowley2w ago

Is the Correction Over? Or Are We Still Looking at a Bear Market?
The S&P 500, NASDAQ 100, and Russell 2000 fell 10.5%, 13.8%, and 19.5%, respectively, from their recent all-time highs down to their March lows Read More
ChartWatchers2w ago

Stock Market Momentum Slows Down: What This Means for Investors
The stronger-than-expected Services PMI reported on Monday injected optimism into the stock market. There was also some relief as news hit that the April 2 implementation of tariffs may be scaled back Read More
The Mindful Investor3w ago

Key Levels for AAPL, AMZN, NVDA — Will This Market Rally Hold?
In this video, Dave breaks down the upside bounce in the Magnificent 7 stocks — AAPL, AMZN, NVDA, and more — highlighting key levels, 200-day moving averages, and top trading strategies using the StockCharts platform Read More
Don't Ignore This Chart!3w ago

DRI Stock Breakout Confirmed: Here's What You Need to Know Now!
Markets surged out of the gate Monday morning, with all three major U.S. indexes notching early gains. But after a bruising two-week rout on Wall Street, the question facing investors is whether stocks can sustain the rebound Read More
DecisionPoint3w ago
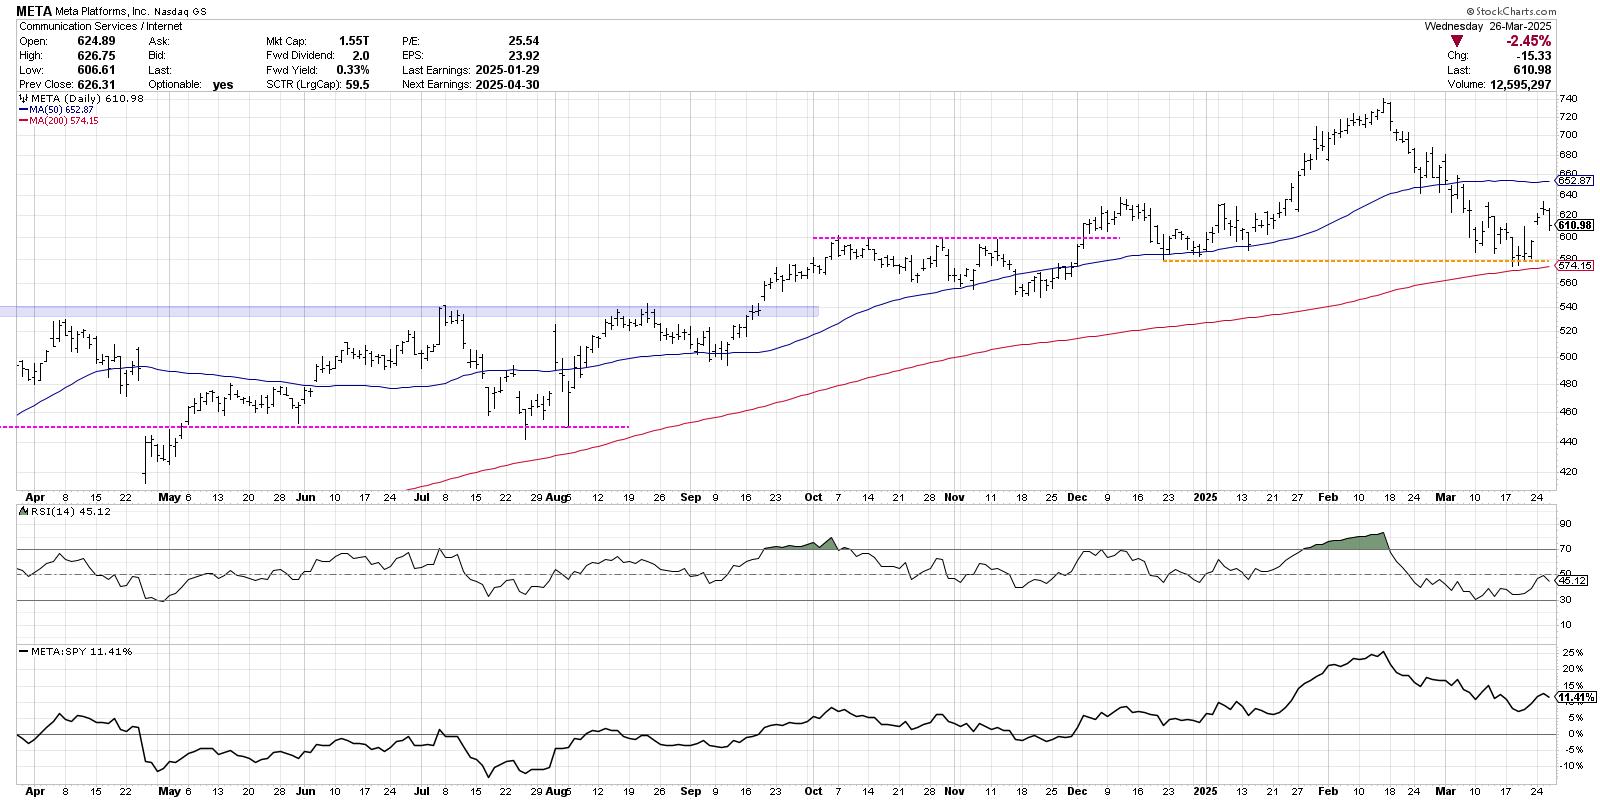
DP Trading Room: Tariffs Narrowing, Sparks Market Rally
Over the weekend it was announced that tariffs will be narrowing and possibly not as widespread as initially thought. Negotiations are continuing in the background and this seems to be allaying market participants' fears. The market rallied strongly on the news Read More
RRG Charts3w ago
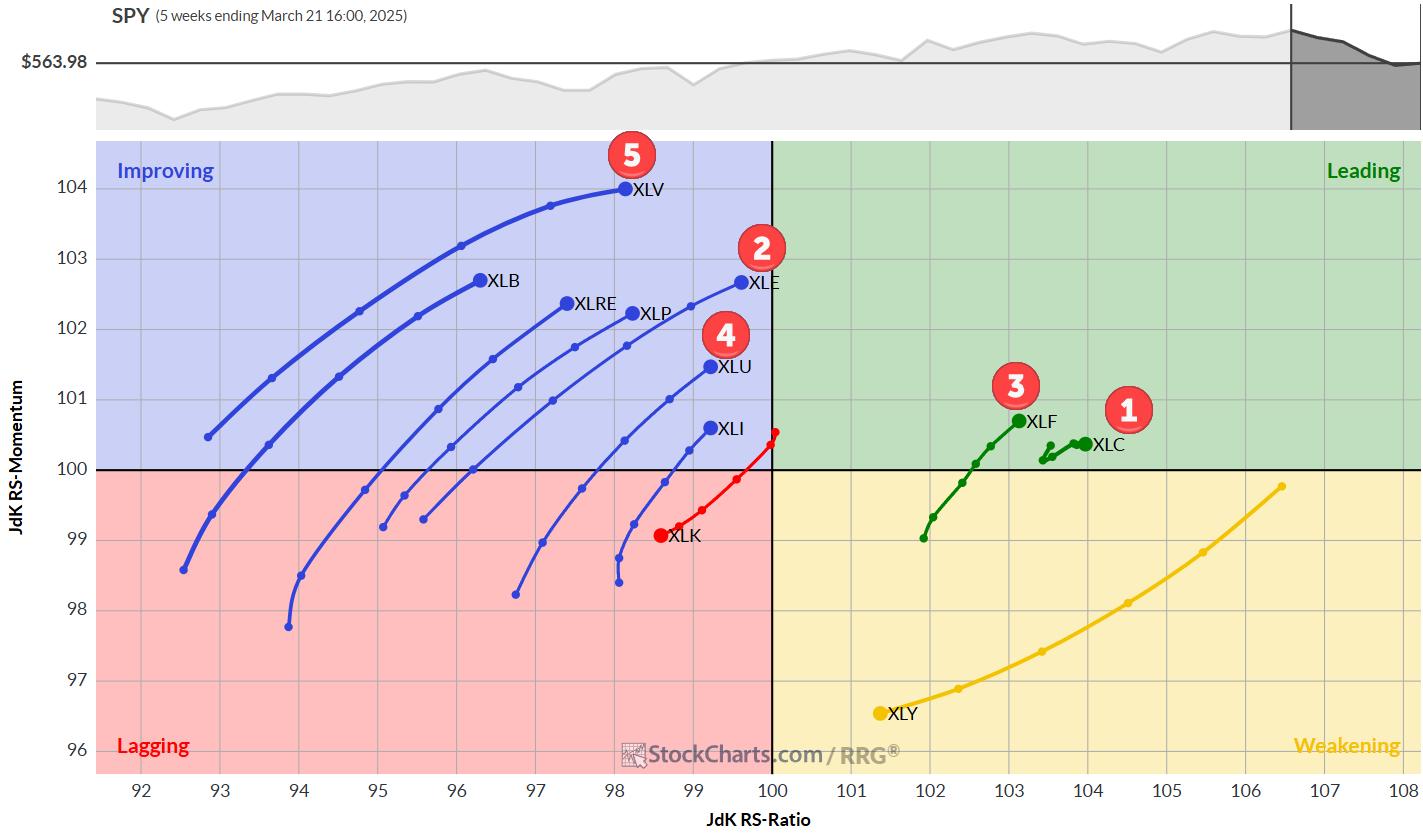
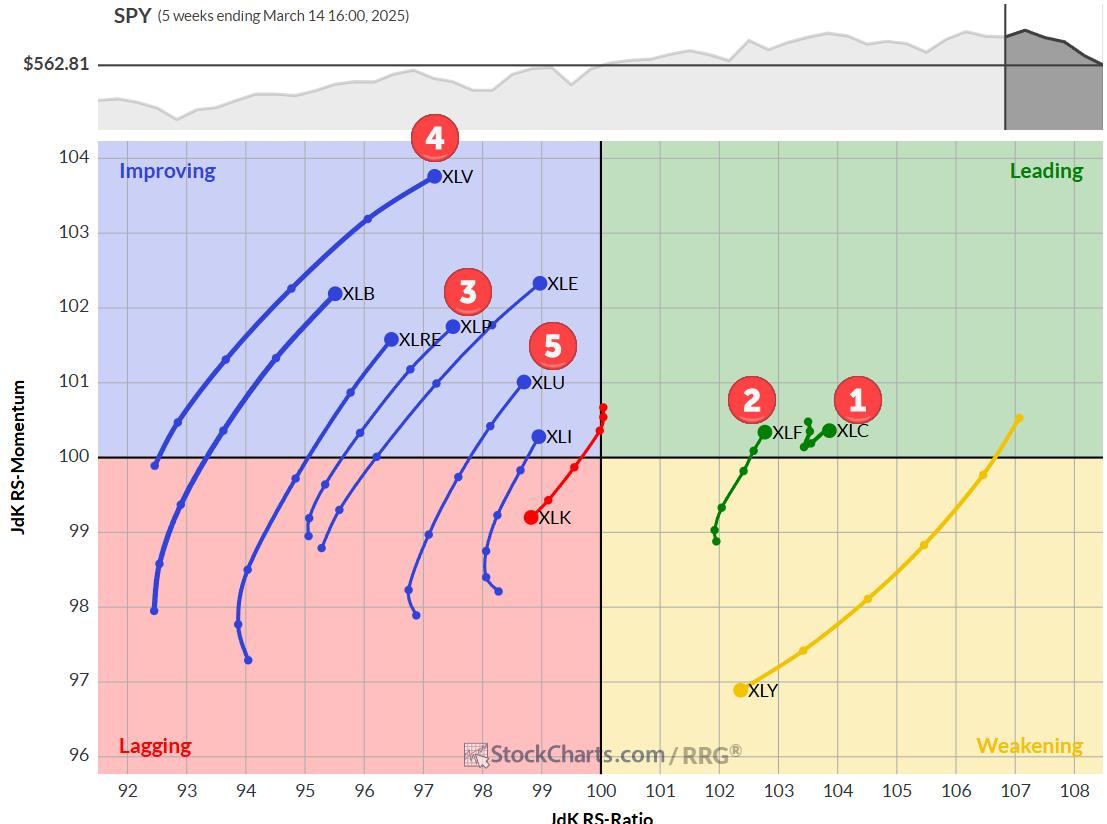
The Best Five Sectors, #12
Energy Jumps to #2 A big move for the energy sector last week as XLE jumped to the #2 position in the ranking, coming from #6 the week before. This move came at the cost of the Consumer Staples sector which was pushed out of the top-5 and is now on #7 Read More
ChartWatchers3w ago

Uncover the Week's Key Stock Market Movements
If one word could characterize this week's stock market price action, it would be "sideways." At least it's better than trending lower Read More
A View From The Floor3w ago

Stocks in Focus: 3 Stocks to Watch
Seeing that the earnings slate is light, this week we focus on certain stocks to watch during uncertain times. If you are jittery and risk-averse, we have two safer (boring) stocks, plus one tech stock that has shown great relative strength compared to its peers Read More
DecisionPoint3w ago

American Association of Individual Investors (AAII) Breaks Record
We wrote about the American Association of Individual Investors (AAII) poll results a few weeks ago. Since then, the bearish activity on the chart has broken a record for the poll Read More
Members Only
Martin Pring's Market Roundup3w ago
Confidence Ratios are in an Uptrend, But Looking Vulnerable
At this week's news conference, Jerome Powell mentioned that the Fed is cautious about making significant changes to interest rates due to unclear economic conditions, citing factors like trade policies and inflation, which have contributed to this uncertainty Read More
Art's Charts3w ago

Two Ways to Use the Zweig Breadth Thrust - Plus an Added Twist
The Zweig Breadth Thrust is best known for its bullish reversal signals, which capture a material increase in upside participation. There is, however, more to the indicator because traders can also use the "setup" period to identify oversold conditions Read More
The Mindful Investor3w ago

Will QQQ Retest All-Time Highs By End of April?
After reaching an all-time around $540 in mid-February, the Nasdaq 100 ETF (QQQ) dropped almost 14% to make a new swing low around $467 Read More
ChartWatchers3w ago

The Ultimate Guide to Building a Sector-Diversified Stock Portfolio
You already know about diversification. You've set your investment goals, picked a benchmark, and decided on the weighting of your allocations. Now, it's come down to selecting the assets—stocks or ETFs—to build your portfolio Read More
Stock Talk with Joe Rabil3w ago

New SPX Correction Signal! How Long Will It Last?
In this exclusive StockCharts video, Joe breaks down a new SPX correction signal using the monthly Directional Lines (DI), showing why this pullback could take time to play out. He explains how DI lines influence the ADX slope and how this impacts shorter-term patterns Read More
Add-on Subscribers
OptionsPlay with Tony Zhang3w ago
The Top Options Strategy Hedge Funds Use
In a volatile stock market, hedging your portfolio can go a long way in reducing your drawdowns. In this video, follow along with Tony as he uncovers one of the top options trading strategies used by hedge funds Read More
ChartWatchers3w ago

Stock Market Shifts Gears: Indexes Plunge After Climb
Tuesday's stock market action marked a reversal in investor sentiment, with the broader indexes closing lower. The S&P 500 ($SPX), Nasdaq Composite ($COMPQ), and Dow Jones Industrial Average ($INDU) are still below their 200-day simple moving average (SMA) Read More
ChartWatchers3w ago

Riding the Wave: What the Stock Market Rebound Means for Your Investments
Last week, tariff talks, recession fears, and waning consumer sentiment sent stocks lower. This week, the narrative may have shifted, as investors prepare for a macro-filled week and NVIDIA's annual GTC developers' conference Read More
The Mindful Investor4w ago
4 Scenarios for Nasdaq 100: Bullish Surge or Bearish Collapse?
Can the Nasdaq 100 rally to all-time highs or break down below key support? In this video, Dave uses probabilistic analysis to explore 4 possible scenarios for the QQQ over the next 6 weeks — from a super bullish surge to a bearish breakdown below the August 2024 low Read More
DecisionPoint4w ago
DP Trading Room: Upside Initiation Climax?
On Friday DP indicators logged an Upside Initiation Climax. This exhaustion events often mark the beginning of new rallies and could indicate that the market is indeed ready to rebound. However, we do question its veracity given lukewarm trading to begin Monday's trading Read More
RRG Charts4w ago
The Best Five Sectors, #11
Big Moves in Sector Ranking The ranking of US sectors continues to shift. At last week's close, we saw another big shake-up. All defensive sectors are now in the top five. Technology dropped to last place, while Consumer Discretionary tumbled from #3 last week to #9 Read More
ChartWatchers1mo ago

Why the Market is Ready to Rally!
In this exclusive video, legendary trader Larry Williams breaks down why the stock market is primed for a rally, using technical analysis, fundamental signals, and seasonal trends Read More
A View From The Floor1mo ago

Stocks in Focus: Three Stocks Primed for Explosive Growth
Five Below, Inc. (FIVE) has had a rough year, to say the least. The stock is trading near its 52-week lows and 65% below its 52-week highs. The company's CEO resigned last July and, since then, shares have struggled to rebound Read More
The Mindful Investor1mo ago

Three Reasons to Consider Gold
Even with an impressive run of relative performance thus far in 2025, some investors still remain skeptical of gold's uptrend. Let's look at the performance of gold through three different angles, all using the best practices of technical analysis Read More
The MEM Edge1mo ago
Is a New Market Uptrend Starting? Key Signals & Trading Strategies
Is a new market uptrend on the horizon? In this video, Mary Ellen breaks down the latest stock market outlook, revealing key signals that could confirm a trend reversal Read More
DecisionPoint1mo ago
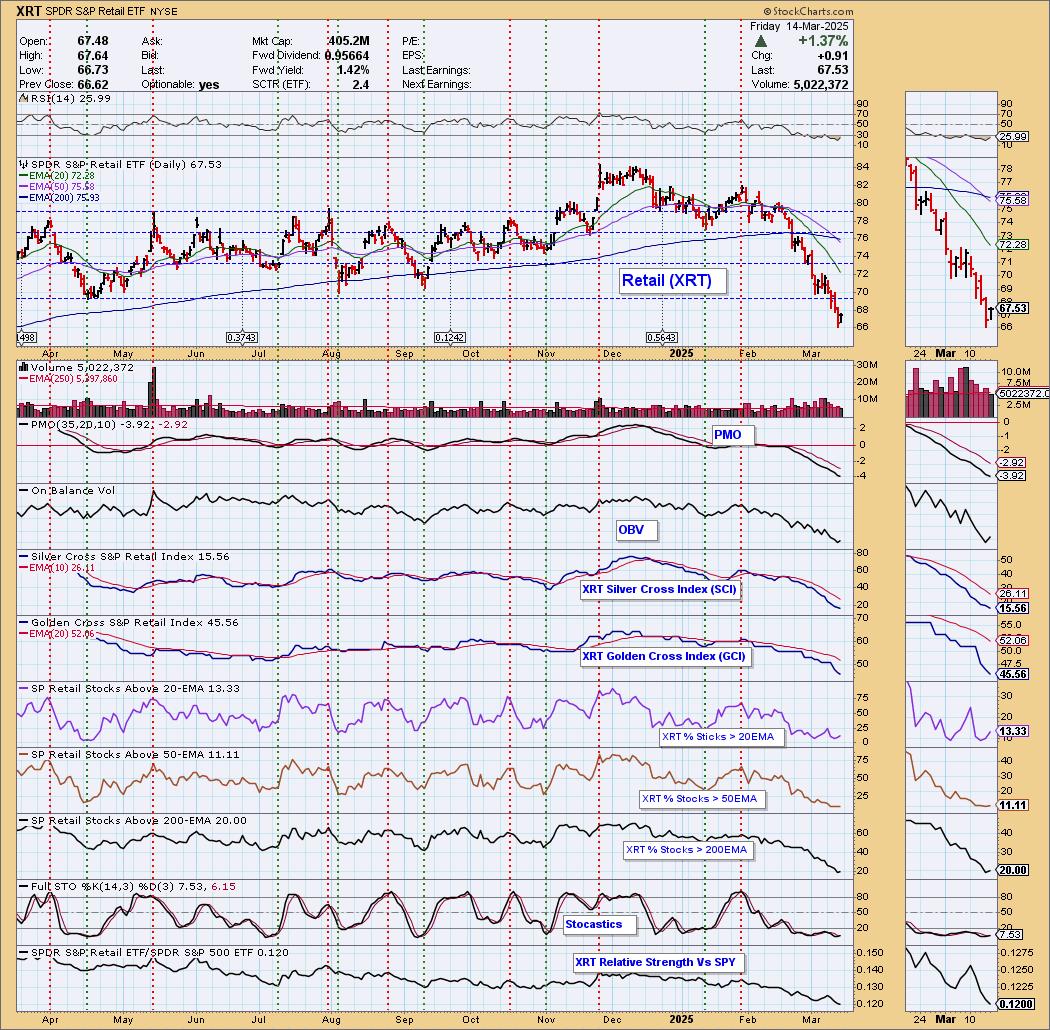
Retail (XRT) Dropping Quickly
It's been rocky for the S&P 500 and particularly rocky for some industry groups and sectors. The market does appear ready to give us a good bounce, but past that we aren't overly bullish Read More
Members Only
Martin Pring's Market Roundup1mo ago
Stocks May No Longer Be the Preferred Asset Class
A couple of weeks ago, I wrote that stocks were beginning to slip against the gold price. Chart 1 shows that the ratio has now decisively broken below an important uptrend line, marking the lower region of a three-year top Read More
Art's Charts1mo ago

SPY Reverses Long-term Uptrend with Outsized Move - Now What?
The weight of the evidence shifted to the bears over the last few weeks. First, the major index ETFs reversed their long-term uptrends with Bollinger Band signals, our breadth models turned net negative and yield spreads widened Read More
RRG Charts1mo ago

Sector Rotation Breakdown: Spotting Market Leaders Now
In this exclusive StockCharts video, Julius analyzes US sector rotation using Relative Rotation Graphs (RRG), starting with the 11 S&P sectors and breaking them into Offensive, Defensive, and Sensitive sectors to uncover unusual market rotations Read More
ChartWatchers1mo ago

Tariff Turmoil: 3 Stocks You Need To Know Right Now!
No one can predict how tariffs will play out or how severe their effects will be on everything from consumer goods to the broader economy. But investors have gotten a taste of the market chaos such uncertainties can bring Read More
The Mindful Investor1mo ago

Five Stocks Showing Strength in a Bearish Tape
Where can investors find a safe haven during a period of market uncertainty? Personally, I think it's as simple as focusing on the stocks managing to display bullish technical structures at a time when they are becoming remarkably rare! Today, we'll use the StockCharts scan engin Read More
Popular Articles

The Bottom is Here or Rapidly Approaching

This Report Might Self Destruct in 5 Days

Investors on the Move: A Visual Guide to the Stock Market

Is the Stock Market Getting Ready to Bounce? Key Market Breadth Signal Explained

S&P 500 Final 2024 Q4 Earnings: Still Overvalued

Trade War Mayhem? Here's How to Cut Through the Noise!
Get expert technical commentary delivered straight to your inbox! Sign up for our FREE weekly ChartWatchers Newsletter. Learn More
Featured Authors


Public ChartList Leaders


StockCharts Members unlock complete access to the Stocks & Commodities Magazine archives. Read the latest articles or browse past editions.