Good Day,
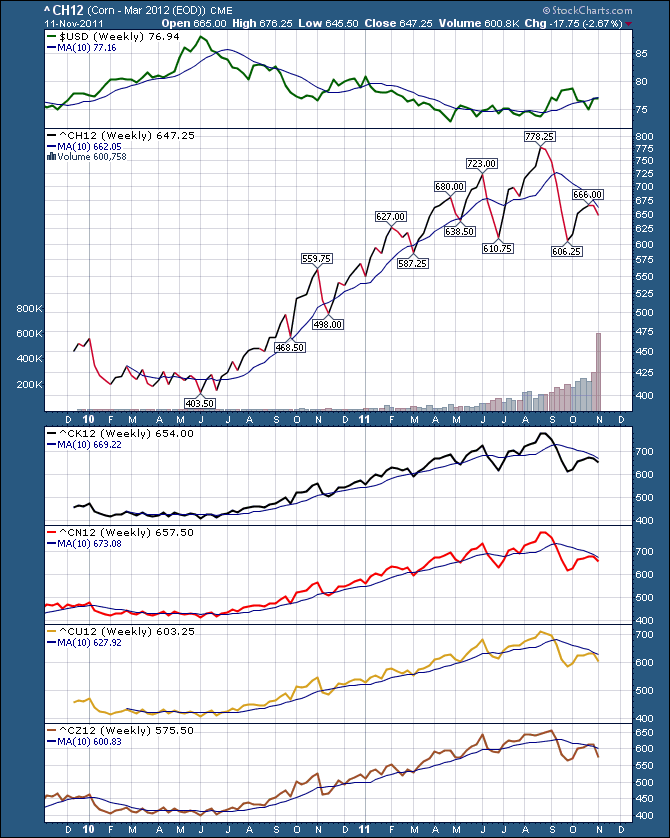
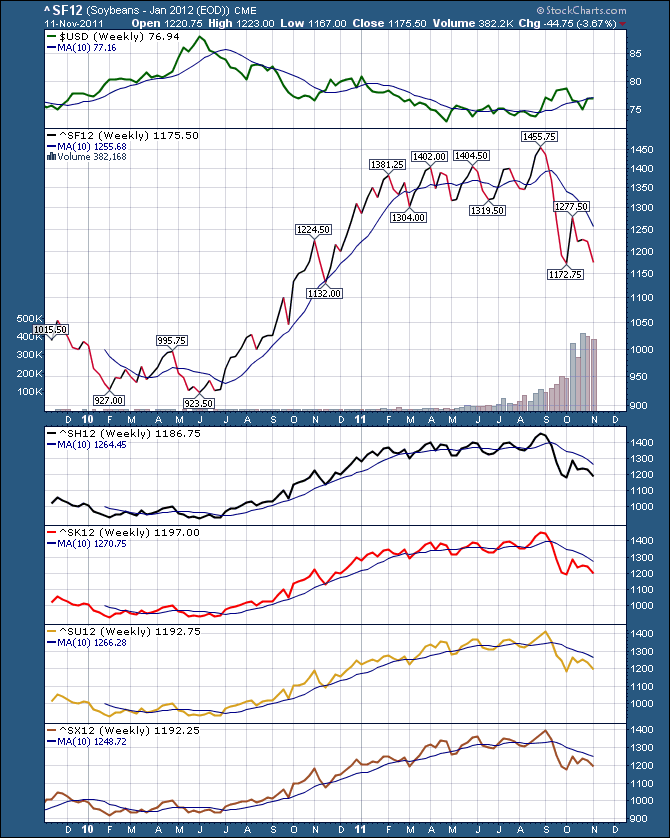
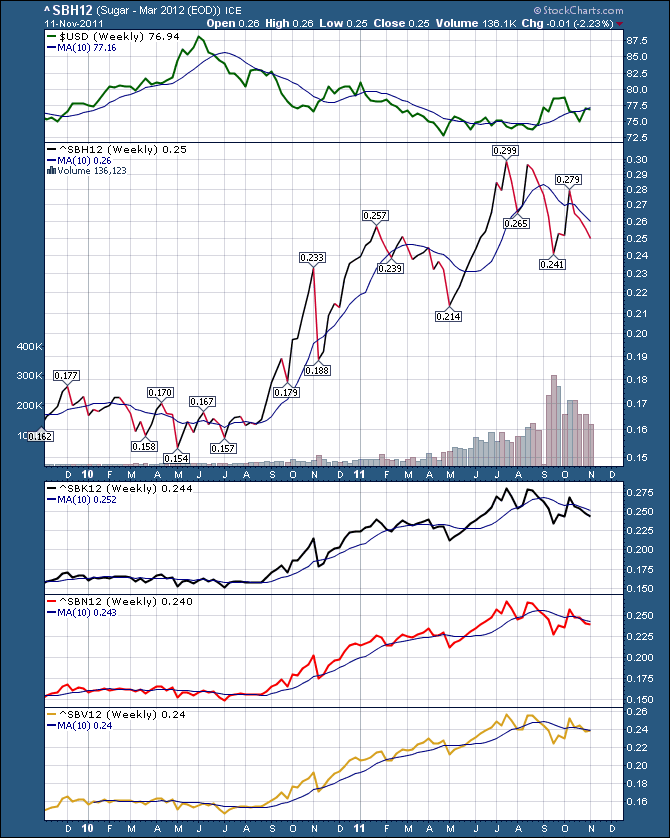
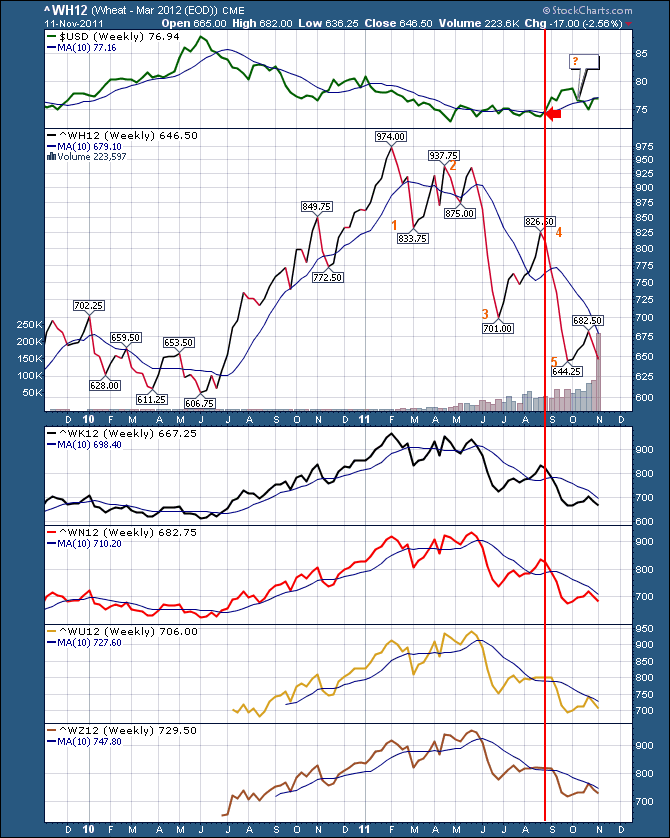
Lets just briefly check the dashboards. All of the symbols for the charts are just farther out months on the futures. So each chart has the nearest month first, then progressing to the longer months.Usually a year out.
Here is Corn. Trading below the 10 week.
Soybeans - trading below the 10 week
Sugar - trading below 10 week
Wheat - Trading below 10 week
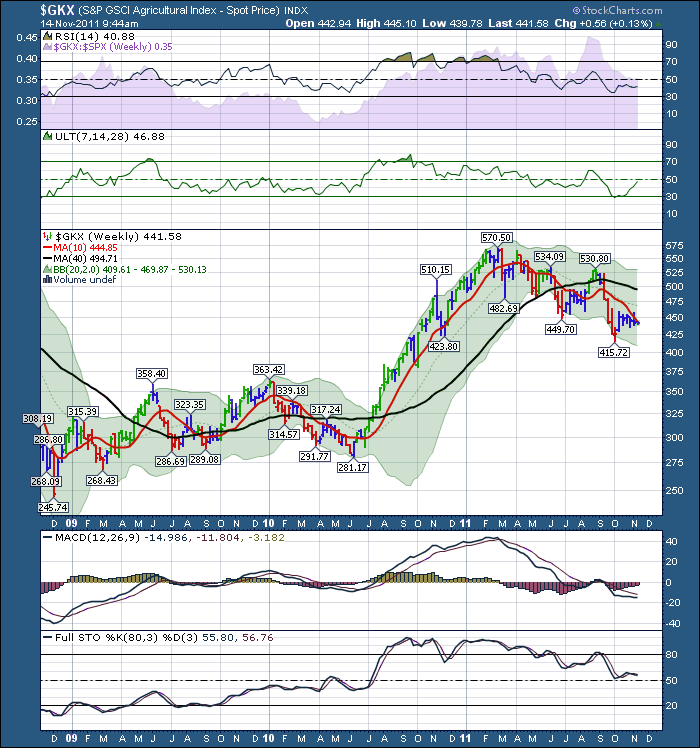
Goldman Sachs Commodity Index (GSCI) Agriculture trading below the 10 and 40 week.
As an aside, anything purple on any of my charts is SPURS (My Acronym) - SP 500 relative strength. Usually it would appear either behind the RSI or behind the price chart or usually both on my daily charts. On this chart it is just behind the RSI as an area chart.
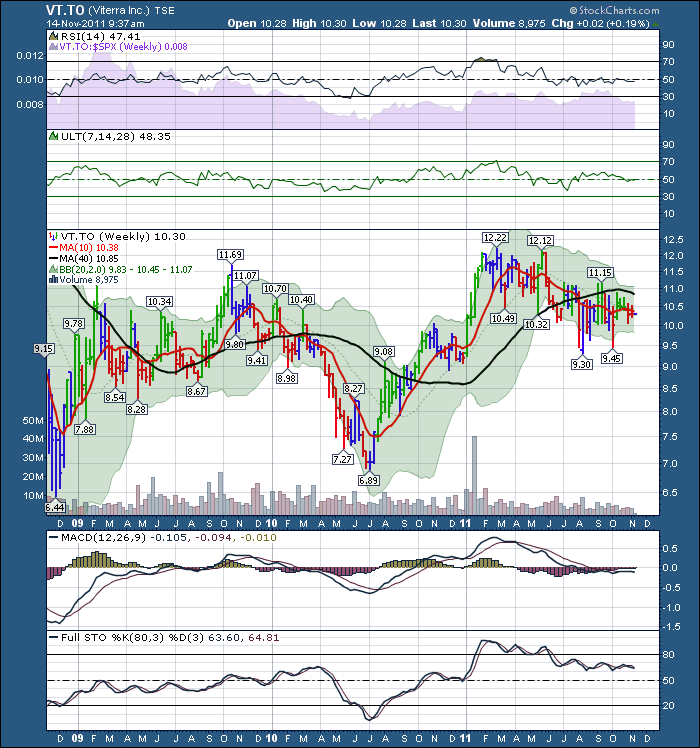
Viterra - trading below the 10 week / 40 week.
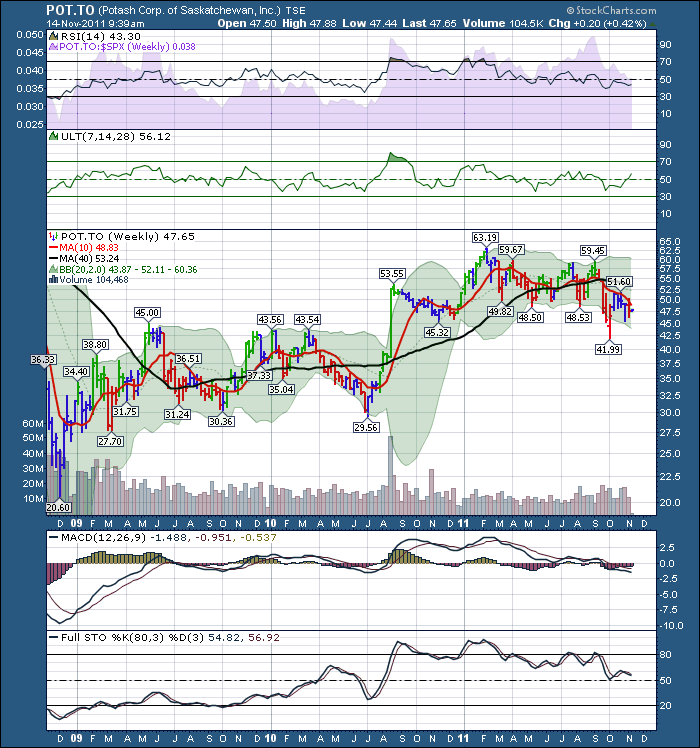
Potash Corp - trading below the 10 Week / 40 Week
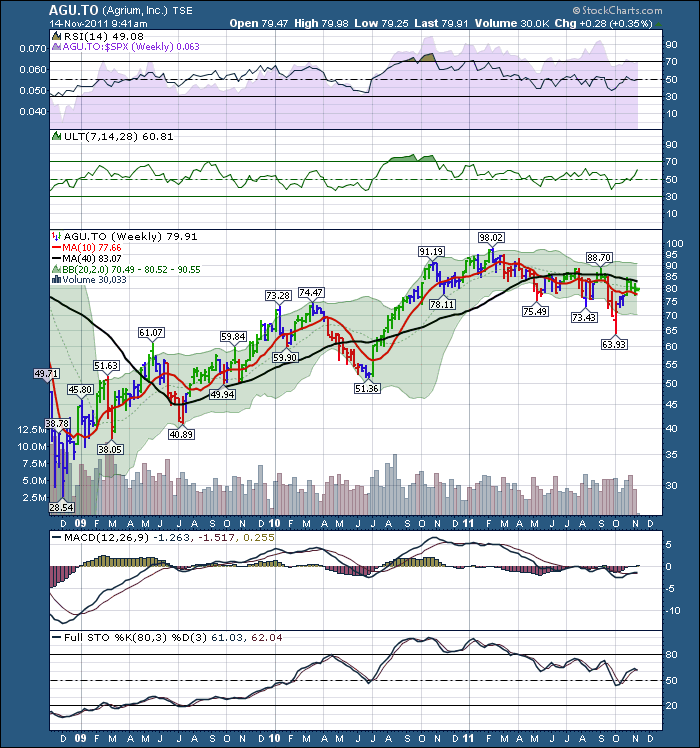
Agrium Trading above 10 week , below the 40 week.
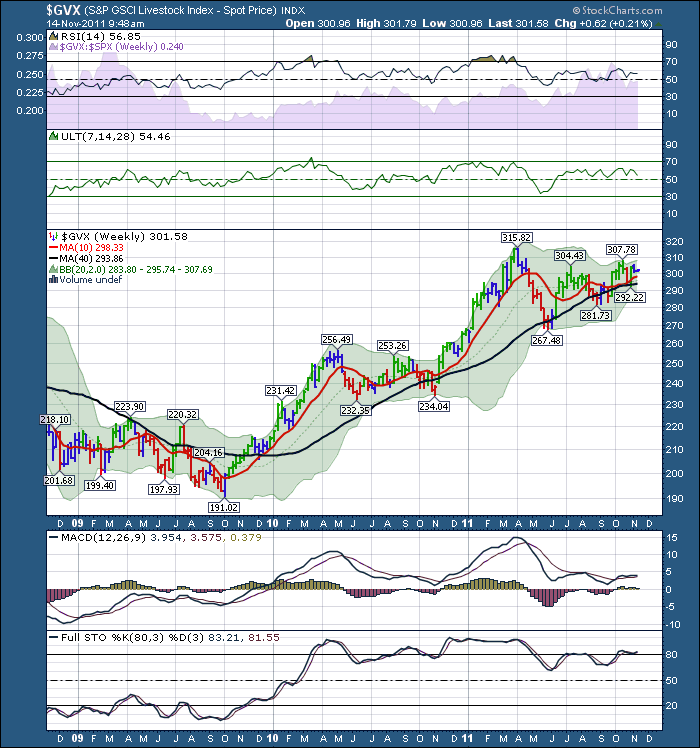
Here is one segment of Agriculture going higher... Livestock.
OK. Everything is still below the 10 week except livestock and Agrium. Let's keep watching, but it's not here yet! Let's hunt elsewhere for opportunities.
There are just so many interesting charts to share...I'll try to share more dashboards this week.Everything is at resistance, trying to stay above support. Interesting times! Feel free to comment, as I enjoy getting positive feedback and other thoughts. One of the comments on the crude discussion was a rising wedge which I failed to mention...thanks to all who take the time to dialogue.
To subscribe to the blog, Click here. Look top right on the page for subscribe, RSS or Twitter.
Good Trading,
Greg Schnell, CMT

