Well, that was a very interesting week in the oil and oil stocks market.
First of all, let's review crude oil and where it is priced.
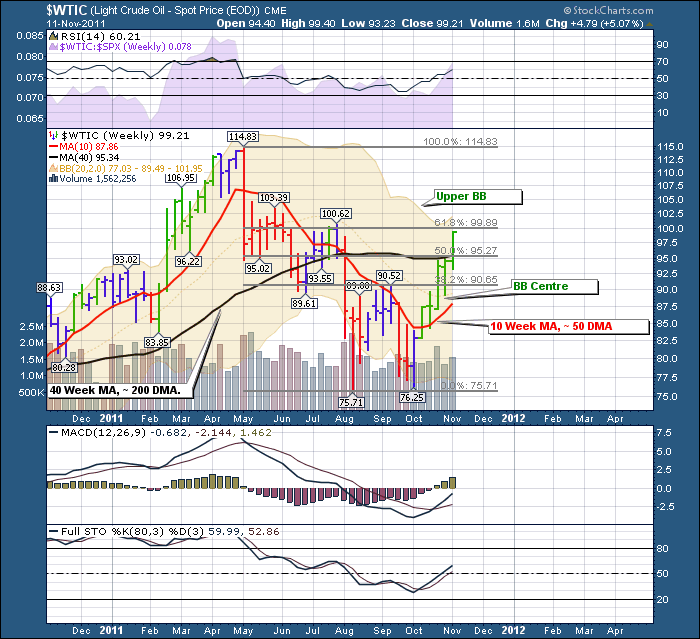
In the blog a few weeks ago, we suggested a good upside target for oil would be arond $99. How did we come up with that? At the time oil was in the $93-$94 level.
1) The 61.8% fib level is shown in gray on the chart. It was $99
2) The top of the BB has moved up slightly this week to $101. A few weeks ago, it was close to the same level as the BB. Remember, you can read the actual values in the top left of the chart.
So here we sit with a substantial move higher in crude. From October 4th to November 14 Crude has moved over 30% in under 6 weeks. Who would have called that? Great Question...
Let's stare at the chart.
A few things I notice.
1) We have previous weekly highs here at $103 and $100. We have the BB at $101 and we have the fib level at $99.
2) The enthusiasm for crude to run up from here will be muted in that a crude price above $100 really cuts into consumer spending as they allocate more towards gasoline and home heating oil.
3) In order for $WTIC crude to go lower, it first has to have some of it's momentum slow. For the last 6 weeks, we have closed near the highs of each week.
The price of oil reflects a lot of currents in the world. Some traders believe energy or food like grains will be the actual store of value in the world. Here we have crude soaring almost $5 this week again, as the debt crisis becomes more paramount. One of the arguments against the belief that gold is the primary store of value is that it serves no real purpose. Every ounce that was on this earth still is. Another point of view is the modern world does not need gold for money as so much is electronic rather than manual exchange. So, let's keep our peripheral view watching to see how oil behaves as sovereign debt continually becomes a problem. I recognize it also reflects the Iran nuclear discussion. So let's look at Brent to see what happened there.
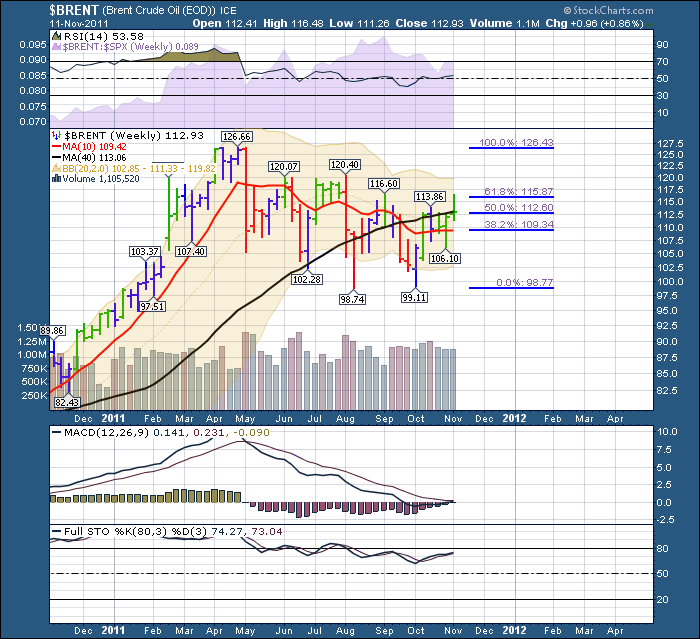
The Brent price went up to the 61.8% retracement and retreated to close right at the 200 DMA. Brent also closed right near the bottom of the candle. How do people trade these markets without technical analysis..I have no idea! The price reversed a long way away from the top of the BB. So Brent did not seem to care about Iran or Debt!
The bottom line here is : $WTIC traded significantly different than Brent this week. A spread that was as wide as $28 a few weeks ago has shrunk to $14 this week....It's the wild wild west!
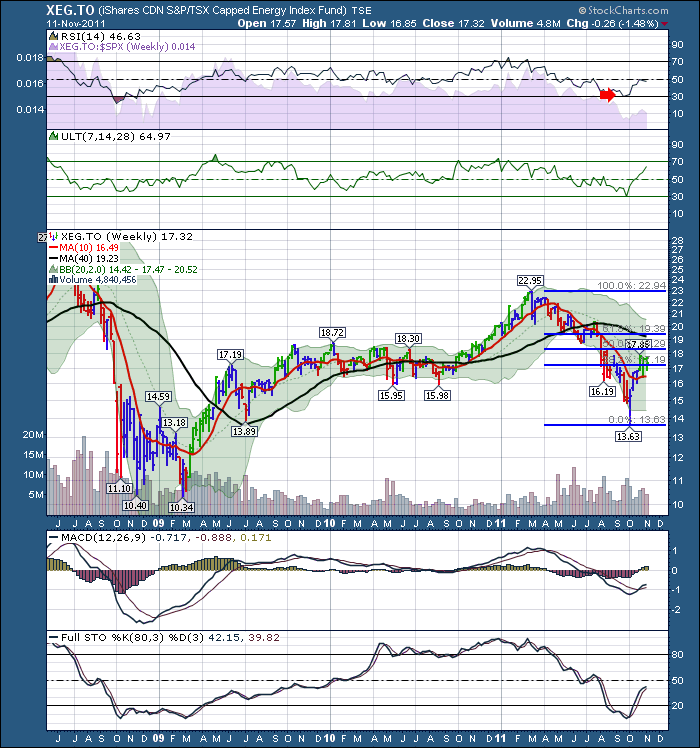
Let's compare the price action in Brent and $WTIC to the price action in our energy stocks.
Wow what a difference again. This chart has not reached up and challenged the 50% retracement let alone the 61.8% retracement. It seems stuck at the 38.2% retracement.
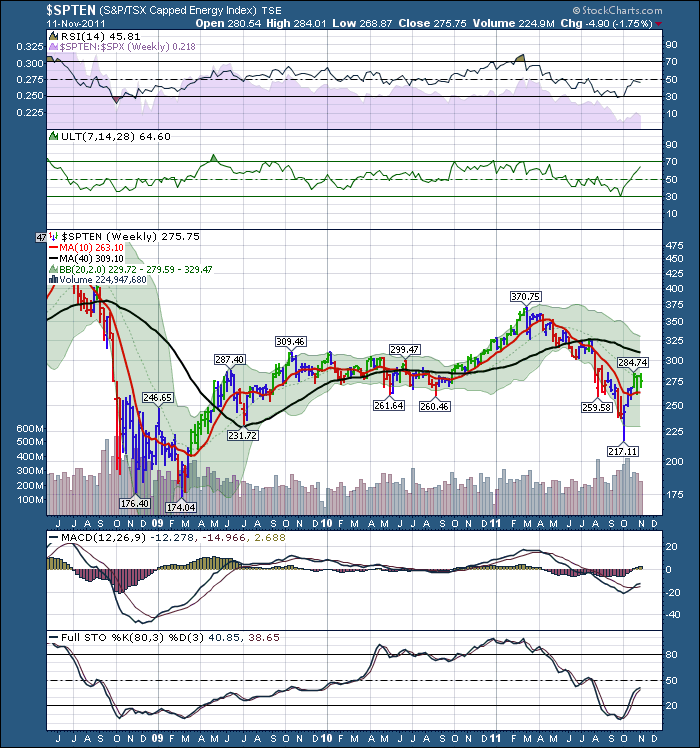
We can also use the Index chart. $SPTEN.Same information. No real push higher like the oils.
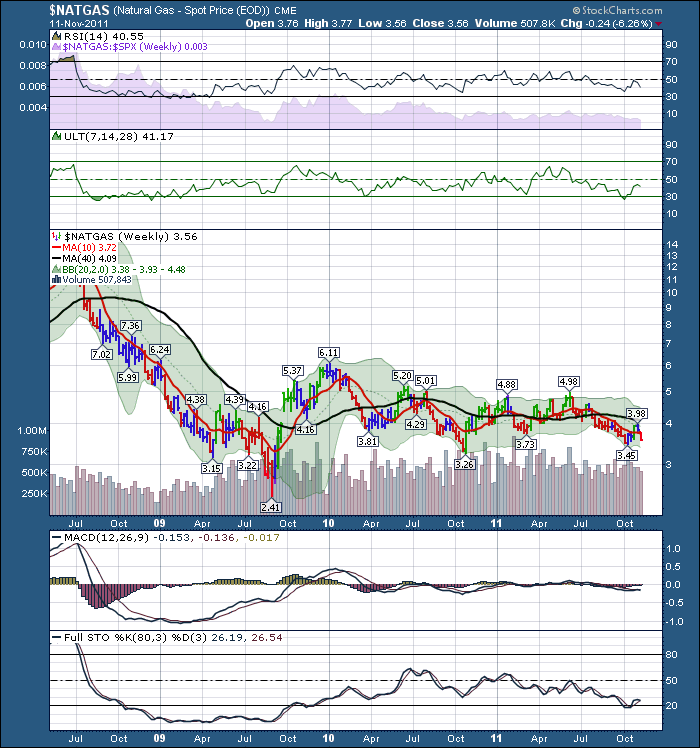
This can be partially attributed to the $Natgas chart hitting new recent lows this week.
Here is $Natgas
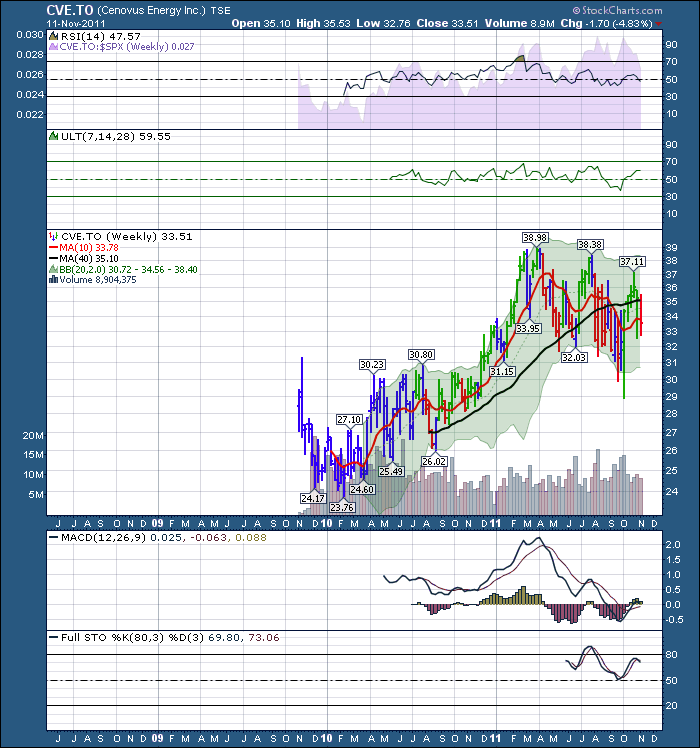
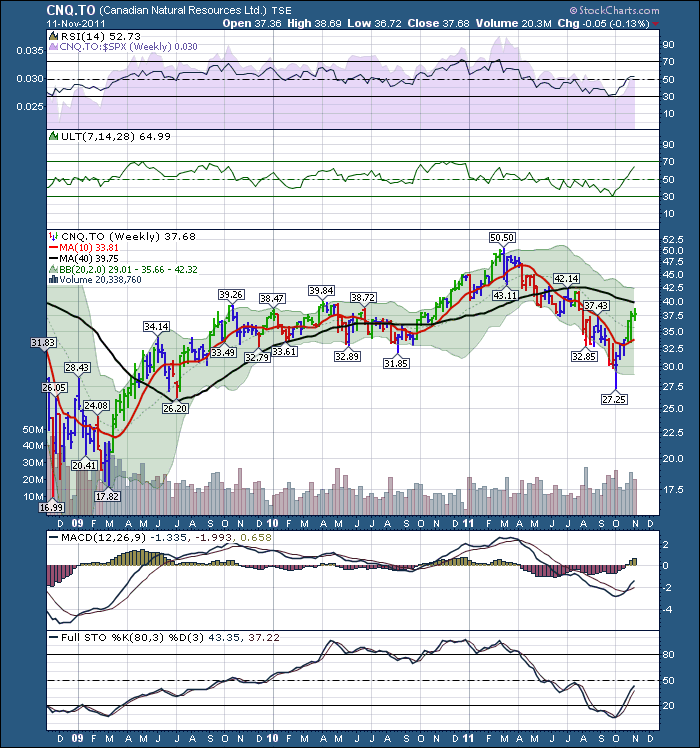
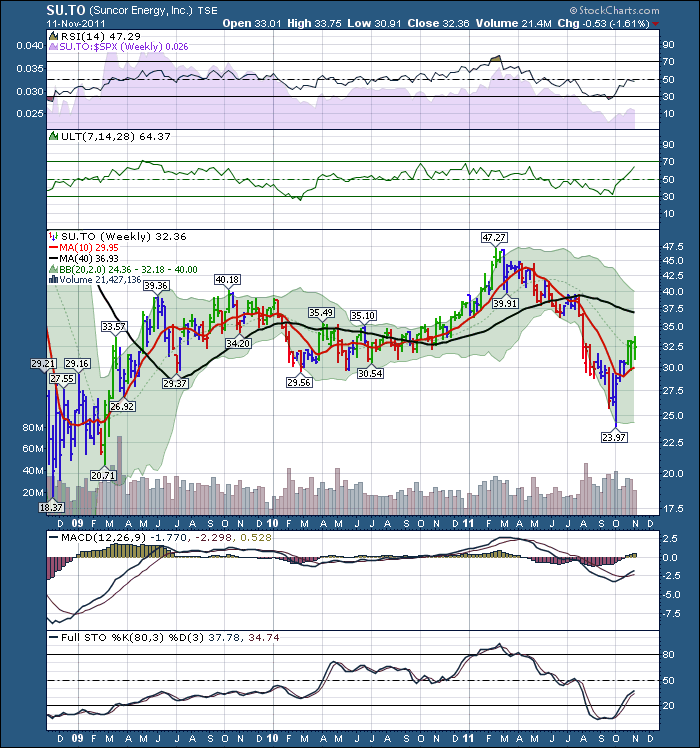
OK, that might explain some of it, but lets look at some heavyweights like CVE.TO, CNQ.TO and SU.TO
Remember Suncor has a lot of refinery or 'integrated' composition so it may look different.
Here is Cenovus. This is a pure oil play. SAY WHAT? This failed at the 40 Week DMA, failed the 10 Week DMA and closed at the lowest close in 6 weeks. The close this week was lower than the close of the bounce off the October lows. That's a train wreck relative to the oil commodity charts.
Here is CNQ.TO This chart traded much closer to the Brent chart. Up 5 weeks in a row, close to flat week on week and trying to reach up to the 200 DMA.
Lets go see Suncor. This one has its lowest close in the last three weeks. It tested higher this week, but closed lower than the last 2 weeks. Crude oil up in North America, Brent up on the week in Europe. Suncor has some International operations but they are dominated here in North America with the Petro Canada Refinery network, the Oilsands production. Very confusing.
Well, all that to say it's a wild wild west out there. Brent closed well off the highs but still finds support at the 40 Week, $WTIC soaring right through the 40 Week, The spread between Brent and $WTIC was cut in half, Cenovus getting crushed, Suncor price action following Brent more than $wtic, and CNQ following Brent even though they have substantial North American operations. $wtic at new 2 month highs, Brent failing at fib resistance, Natgas at new recent lows with high inventory, Cenovus losing support at both the 10 week and 40 week to make the lowest close in 6 weeks, Suncor making the lowest close in 3 weeks and CNQ closing almost as high as last week which was a fresh high.
None of the oil stocks have made it back to their 40 week, but both the oils are at or above the 40 week, as $Natgas makes lower lows.
We'll need this week to start demonstrating some trends. With the oils trying to break through overhead Fib resistance they may struggle to keep going higher unless the stocks start to agree. The stocks are not anywhere near their 40 Week lines, it seems bizarre.
The map looks like a dartboard currently!
To Subscribe to The Canadian Technician blog, click on the link and you'll fins subscribe up in the top right.
Good trading,
Greg Schnell

