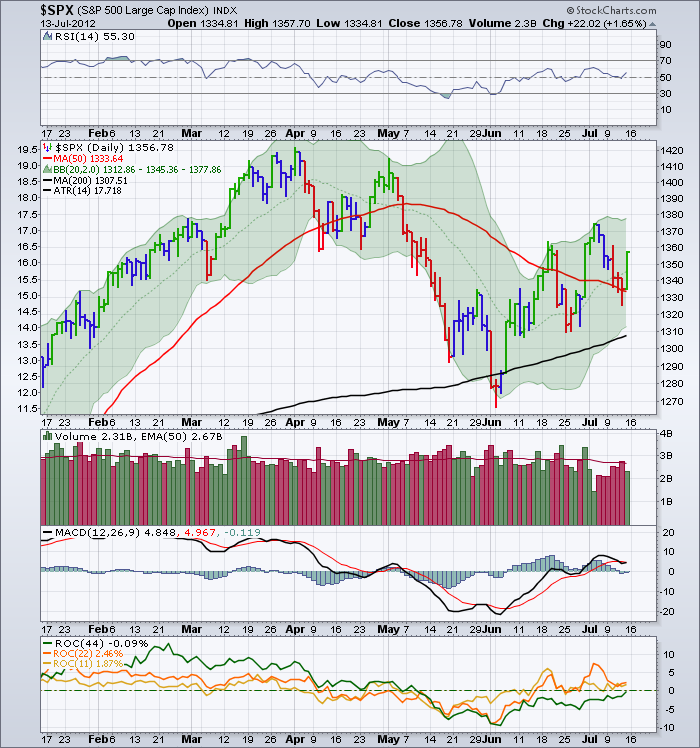
Here is the current $SPX.
Sitting in the middle of the six month range, bouncing off the 200 DMA. Now compare with 2011.
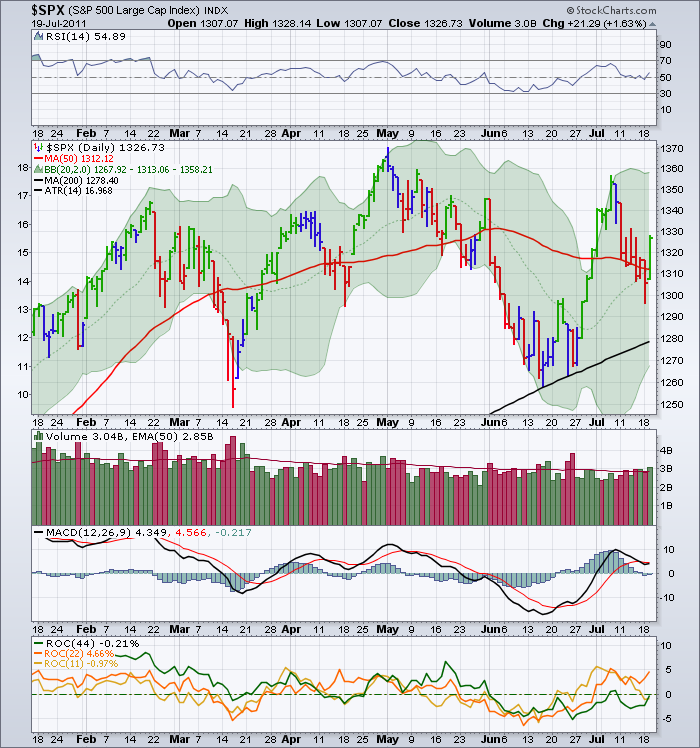
Here is last years $SPX.
All the indicators and oscillators are behaving the same. Even Warren Buffet says the world is flat. So my bullishness is tempered when a guy with great internal data starts being less optimistic. That doesn't mean a 12 man Calavry won't come save the world with some shock announcement, but it does mean caution looks better here than valour. We still have Apple to report blowout earnings one more time, so until that happens, things look to stay around here. I think the Apple surge was the final high last year, but I may be mistaken.
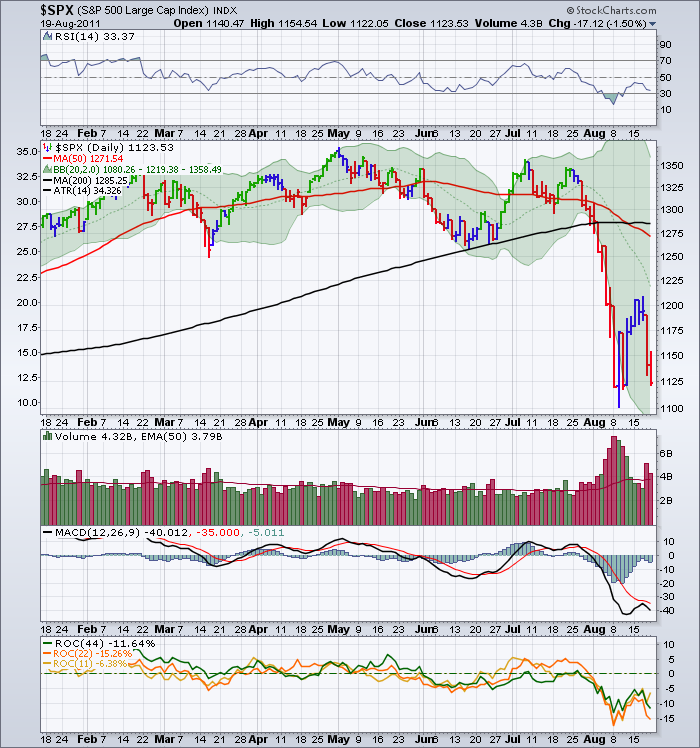
In Case you don't remember, Here is how the addition of a month looks on that chart.
The $SPX lost 250 points in less than a month.
As pattern recognition has proven valid in many cases, we seem to be setting up the pattern again. So we could look for us to test the 1380 -1400 level and then roll over seems to be the plan as I see it. How about you? At least I'll be prepared should it start to happen. This is a conference in Canada that I will be hosting with the CSTA. We look forward to seeing you there. It has an astounding list of international speakers! Please register soon!
Good Trading,
Greg Schnell, CMT


