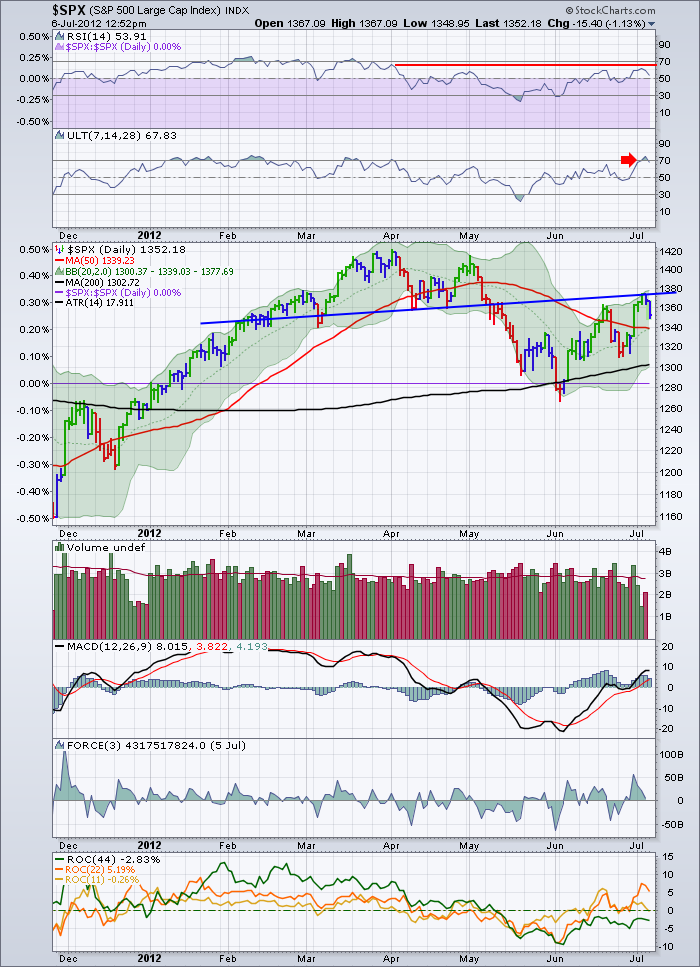
The Ultimate oscillator is on some of my charts. It has tagged the top already on the move up. When we enter a strong period, it can continue, but in a traders market it seems to be keenly aware of where the tops are. Here is the daily. The other thing on the daily is the neckline support of the recent H/S topping pattern is the resistance line we hit yesterday. You could draw a flat line at the 1360 level if you don't like sloping patterns. Whatever, this level is critical.
I plan on following my trading plan. If the market can't hold up here through the earnings period, I am very uncomfortable staying long. The bond market is not confirming the move higher which makes the rally more suspect. The bounces in minerals and commodities were some support. The market needs to be able to find buyers at these levels to start the next uptrend. One of the critical pieces of news that was a surprise this week was China doing another rate cut on interest rates. That was definitely a worrying sign to say their market may not be basing.
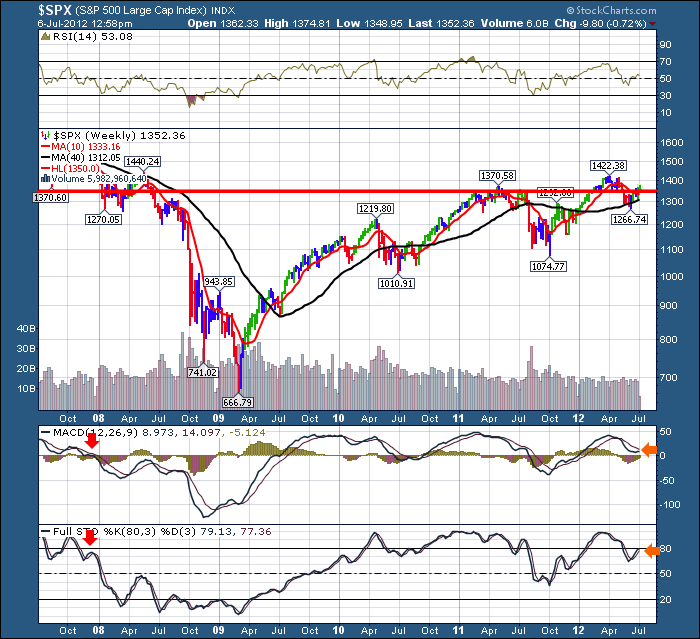
The news feels like a bear market, but the $SPX is currently above the 40 week and 10 week. Should that fail to hold, this is where bear market charts start. A failure to stay above the 40 week MA would be that bear market signal.
The market has rallied for a month off the June lows but it looks more overlapping and less impulsive. A worrying trend. The $TSX has a nice bullish divergence, but that would probably unwind if this $SPX chart fails to hold the 40 week MA.
Good trading,
Greg Schnell, CMT


