The scan engine has created some terrific lists for us to review.
Now we need to narrow our focus on which stocks we would like to buy. For everyone, there is a different right stock. Some like to buy pullbacks, some like stock volatility to flatten out (narrowing Bollinger Bands), some like to buy breakouts. Some like to trade with options, some like to buy stocks for the dividends. There is no right method. It is what works for you. The SCTR is going to give you a list of strong stocks. You will need to visually scan to see what works for you.
In the last chapter, I mentioned a weekend scan. Just looking for stocks between 75- 81 SCTR score.
So run your 6020 scan to get the stocks with an SCTR > 75.
From there, we want to run this weekend scan. Just show me stocks with the SCTR greater than 75 and less than 81. My sweet spot. You can pick whatever variables you want.
This is the scan. These are my lines of code. Your favorites list number will be different. For more on that, read some of the previous chapters again to keep this brief.
[favorites list is 8] // 6020 SCTR GREATER THAN 75 SCAN
and [SCTR >75] and [SCTR < 81]
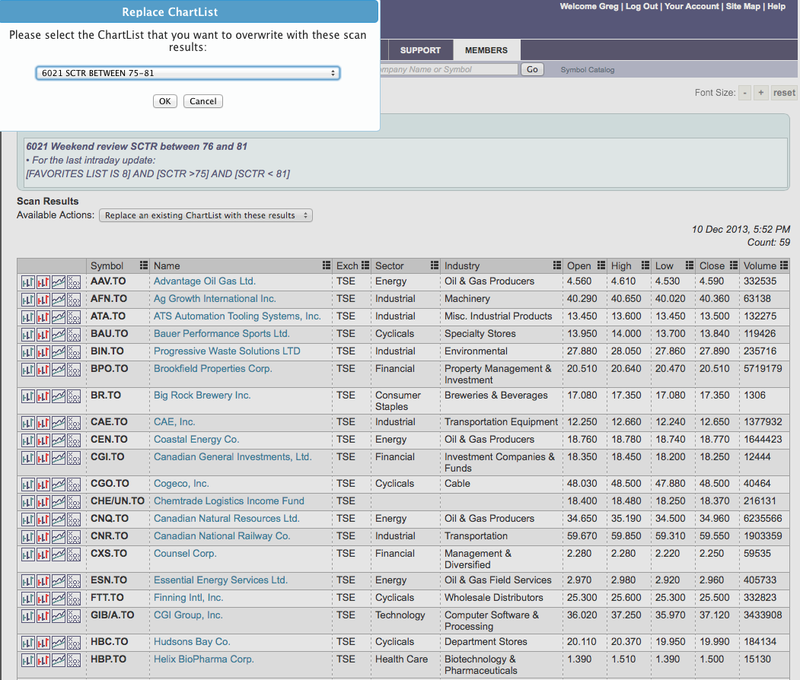
So we run this scan, and we get a list. This morning, before the market opened (so Tuesday close) is what the results are based on. This result list looks like this. A total of 59. I replace the 6021 chart list.
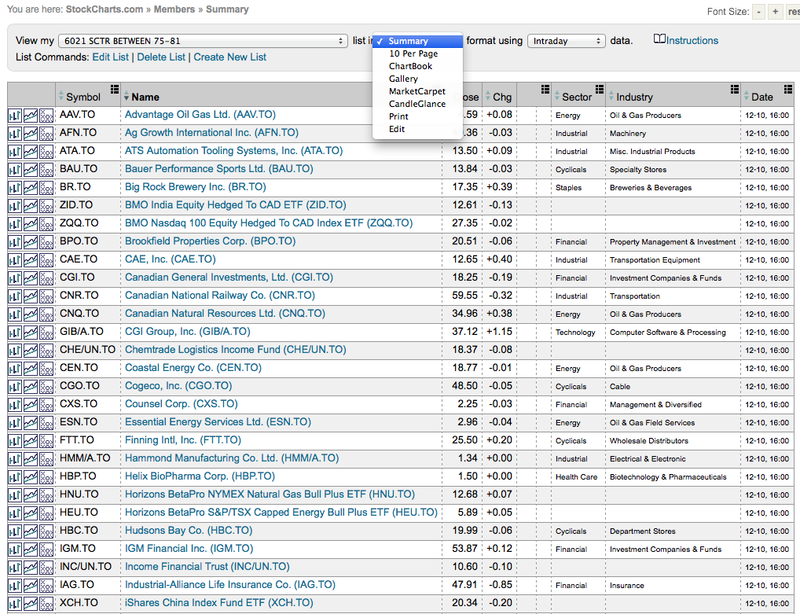
Now they are going to show up in Summary view in your chartlist. You can look at them differently by using the column sort tools to get all the finance ones listed together while still in the summary view.
We have a host of options for viewing the charts. 10 per page just puts them in order and you can scroll through them.
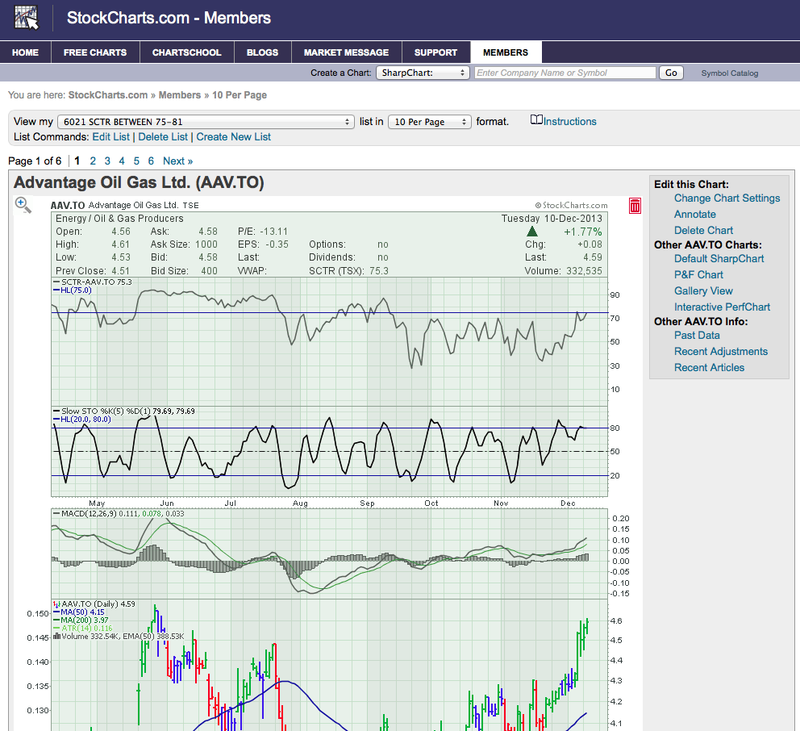
It would look like this.
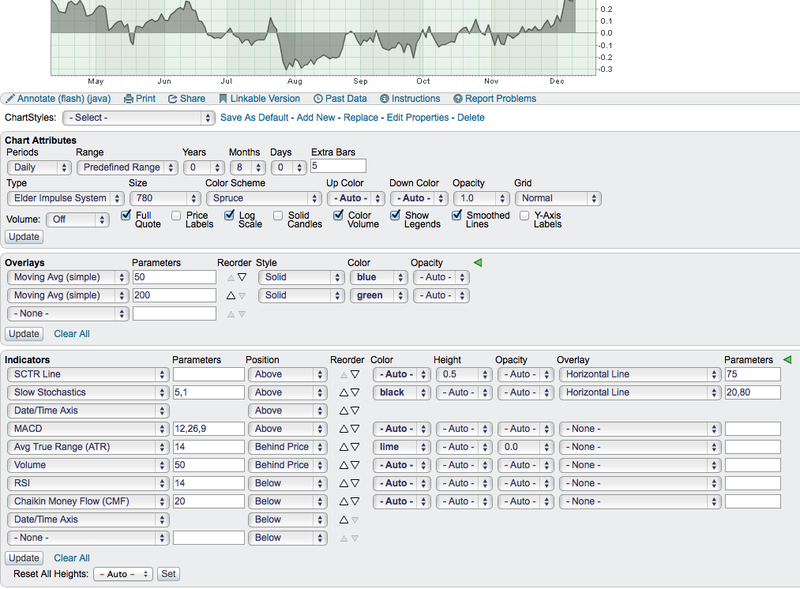
Now when I took this screenshot, I had my cursor highlighting the trash can at the top right so it changes it to red. You can quickly just hit delete if this is not a chart you like. The ChartStyle that will show up is what ever you have saved the charts in that list. So if you like to look at these particular stocks in this list with different settings, the 10 per page view will show the charts exactly as you have saved them in the list. This is the bottom display of the price chart.
In this case, these are the chart parameters I have preset for my charts.
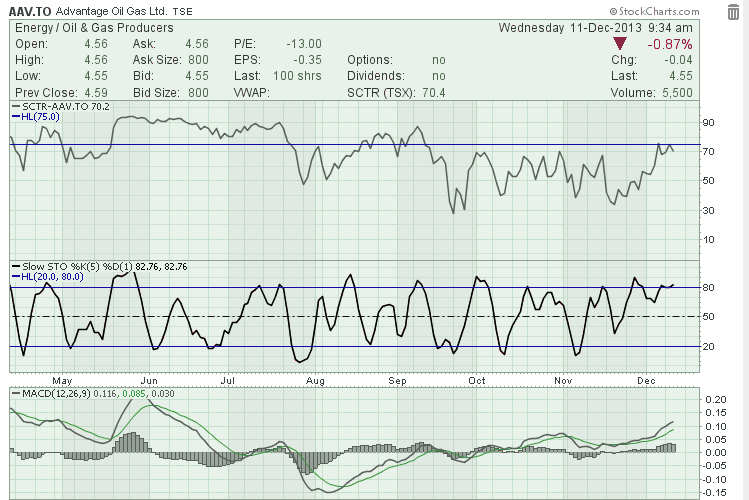
So each and every chart in this list will be the same view. Nice! As you scroll through, you can see each stock SCTR and how it compares to the Blue line. I like to see the SCTR first. My most important field. You can also review the key indicators even before you see the price action.
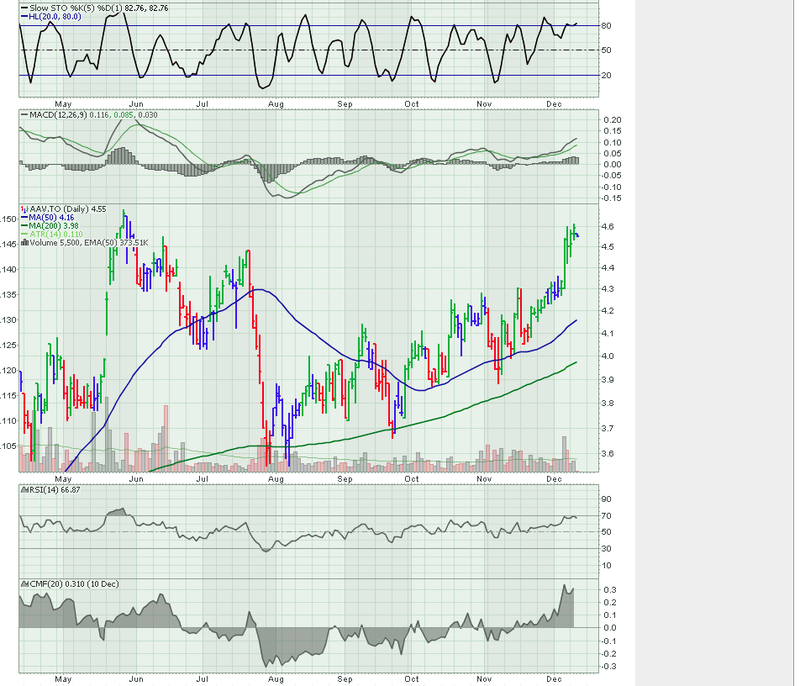
How is the SCTR performing? It has not broken through resistance yet, but it is pretty interesting here. The market has opened, so now this chart is showing an SCTR that pulled back a touch. The Slo Stochastics are running high, so you may wish to wait for a pullback below 20. The MACD is just turning up. Each person will have criteria they like. The bottom half looks like this.
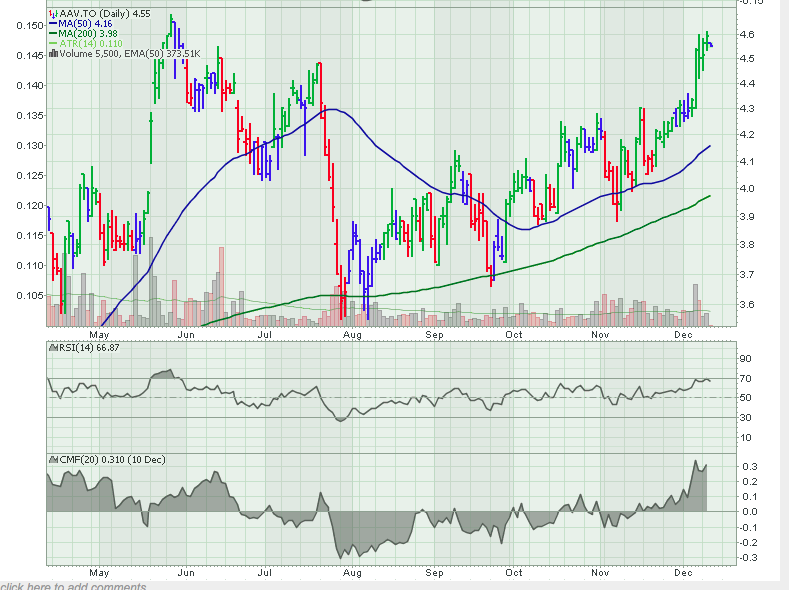
We can see the price, relative to the 50 and 200 DMA. In this case, a nice recent surge. The RSI is near 70 and the CMF is positive and greater than anything we have seen in 6 months. Excellent. It is hard to see on the screen print, but I also have the ATR on the price legend on the left and the style is invisible so there is no line on the chart. It just helps me assess the current volatility of the stock price. Lastly, we can see the volume behind price and on the breakout, we had big volume flow in.
So this all looks positive but it needs just a few days to breath and consolidate in my eye.
So from this view, you can annotate the charts, delete, change settings, and make notes down in the bottom corner. See the grey line. Just add a quick note with a date and your thoughts. you can update it as you scroll through.
The next view style is Chart Book.
This is a little more vertical, with all the controls at the bottom. More like a chart per page or ' Book View'. It uses the same settings you had in the chartlist, it just displays the controls for each chart at the bottom like a footnote. This might be more iPad friendly. You can quickly zoom in, tap the delete button and keep going. You can also quickly add notes.
In the next chapter we will set up GalleryView and CandleGlance views.
Greg Schnell, CMT

