Air Canada had been given up for dead back in the lows of 2012. A few years later, it is 1000% higher and the flights to Europe are very full. I think the summer season looks strong but the chart is at an interesting place. The reason the timing on this chart is interesting is the current attempt to make new highs. In the next few weeks we will find out if Air Canada investors can push the stock to new heights. The moving averages of 10 WMA and 40 WMA are sloped upward in a very positive formation. So what's the worry?
Starting with the RSI, the line is reaching 70 which is bullish. We want to see this continue higher. The purple shaded area is the SPURS and it is continuing higher. Should Air Canada start to under perform the $SPX, I would be more concerned. This purple area would demonstrate that. When stocks have parabolic moves from $5 to $9 in two months, a break of the relative strength line in purple is usually a timely sell signal to capture the majority of the move. Both of these indicators are bullish.
The SCTR is still very strong. I love when that stays in the top 10% of all stocks. The SCTR is not as good for giving off a timely sell signal as the SPURS mentioned above. Moving down the indicators, the Chaikin Money Flow (CMF) has turned negative. For more information on the money flow, see this article in Chartschool. CMF. This change in Money flow is significant and has been going on since the beginning of the year. I tried the setting at 20 weeks as well, but it was the same message. Notice how the Money Flow was pretty timely in the past.
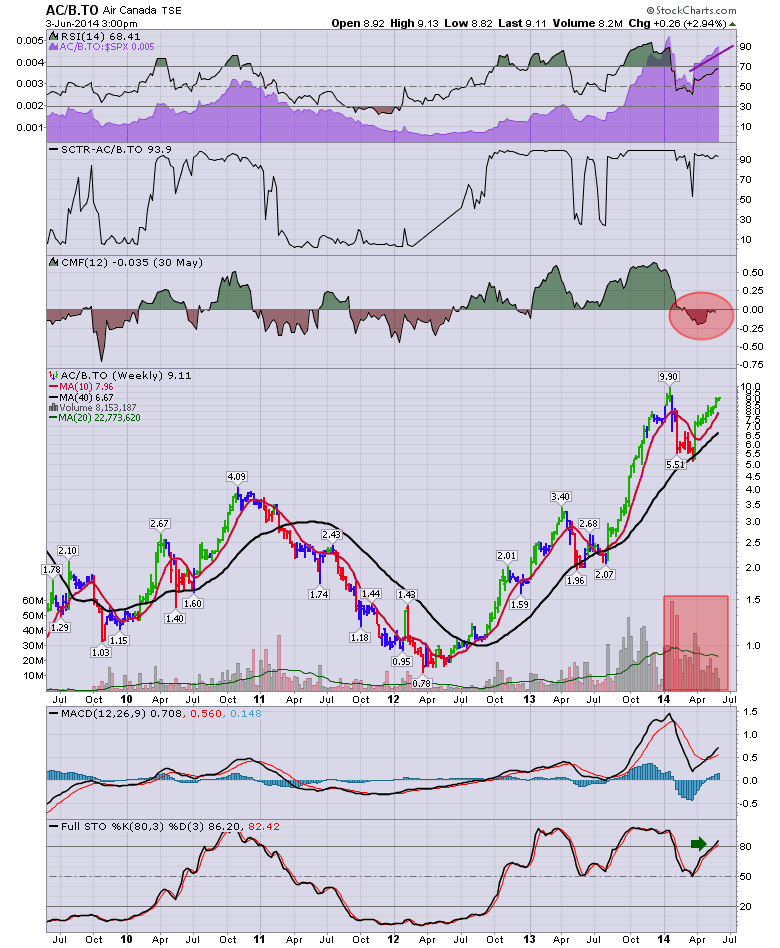
Since April, the volume has been dismal and is tracking 25% less than the average volume. There is also a negative trend in the volume. Since January, the volume is down dramatically. Nothing we can trade off until we see some price erosion. The main question would be why is the volume so light as the stock moves higher? The stock shot up in late March and the volume has been very light since then. One of my concerns would be chasing a parabolic move. The MACD is currently turned up and looks good. I would be watching for weakness starting to show on the MACD and if it rolls over while attempting to make a new high, that would be bearish divergence. Till then it is still bullish. Lastly is the Full Sto with the long setting of (80,3,3). It has stayed in bull territory since October 2012 and likes it up here.
The chart still looks bullish. The hard part is the low volume and money flow. The parabolic move is also concerning especially going into a previous high. I think the travel season looks strong and I recently profiled some of the US travel stocks in a market message for subscribers. I would stay with this trade as long as it continues to outperform the $SPX. Any breakdown on that would encourage me to add protection or move along.
Good trading,
Greg Schnell, CMT


