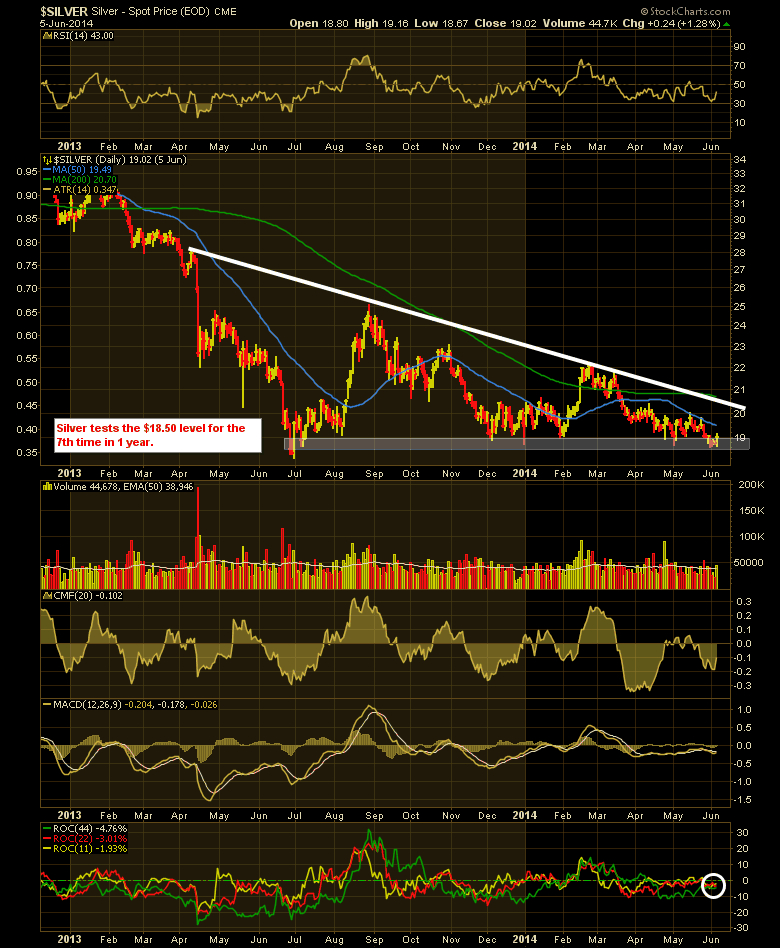
Silver has lead/followed $COPPER and $GOLD lower since the 2011 highs. What makes the $SILVER chart interesting today is the silver market has made seasonal lows in June before and $SILVER is near support. Reviewing the chart, any buyer at the current level is buying based on where support has been before.
When looking at a chart with price action going from top left to bottom right means you are either the consummate against the trend trader, or you have decided that the $18.50 floor that has been established over the past year will hold once again. More importantly, you have also decided this time it is off to the races. While last year saw the price of silver pop 30% off the June lows, and the sentiment index against silver is terrible right now like it was last year means new investors are looking at the base of the chart rather than the down slope. Almost all the indicators are telling you to run away from this. One indicator I have marked that is similar to the Feb 1, 2014 low is the rate of change indicators have all come together near zero. When all the cycles get in tune, it can be a powerful move.
The trader will have an exit planned long before a trade in $SILVER is entered. A measured move of the triangle suggests silver could drop to $10 if you believe in the long term trend continuing. While I am not predicting the outcome either way, both directions would appear to have huge risk of reversal. If you like fishing, finding trophies under water is the goal. If your a bottom fisher, you might be interested in hunting $SILVER now. If your are risk adverse, this is a pond you don't want to fish in.
Good luck and good trading,
Greg Schnell, CMT


