Listening to the news is always a bad way to decide what is really going on. However, today offered more. IBM announced earnings that were considered lacklustre. When you miss revenue by a b-b-billion dollars, somebody notices these small changes!
So I had seen a comment that SAP missed earlier in the day and then IBM missed and it started to make me ponder. Well, I wasn't exactly going to pull out 30 tech companies earnings reports to see what was going on. A picture is worth a 1000 words so lets go to the technical museum of fine art, the charts.
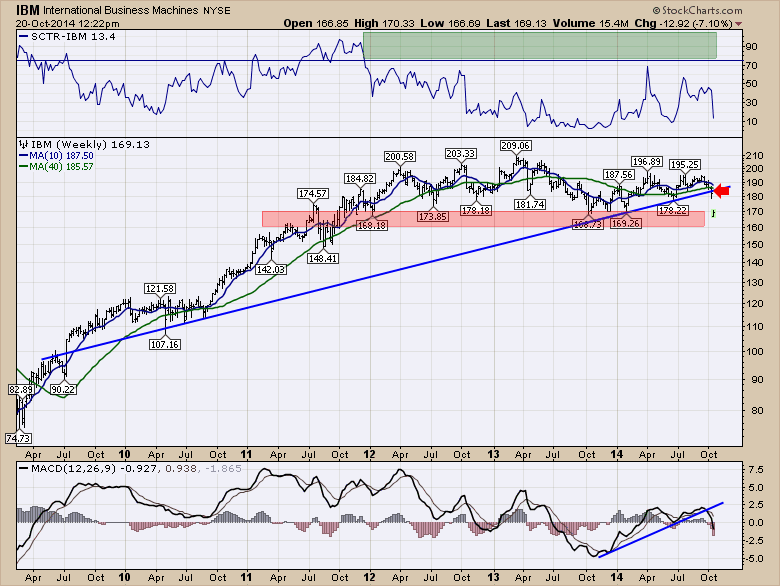
Here is IBM (IBM). Remember today it opened in the high 160's. I have marked the generous zone of support in red. Regardless of the Zone of support, the trend line is as generous as possible. There is only one other trend line and that is horizontal. You can see the SCTR has suggested avoiding the stock for almost 3 full years now. The green area is top quartile performance. It has not been there in three years. IBM has been buying back stock rather than doing acquisitions.
So IBM is a firm that consults to many of the worlds largest companies. Who else does that? Well ORCL is a big financial systems provider for enterprise wide software.
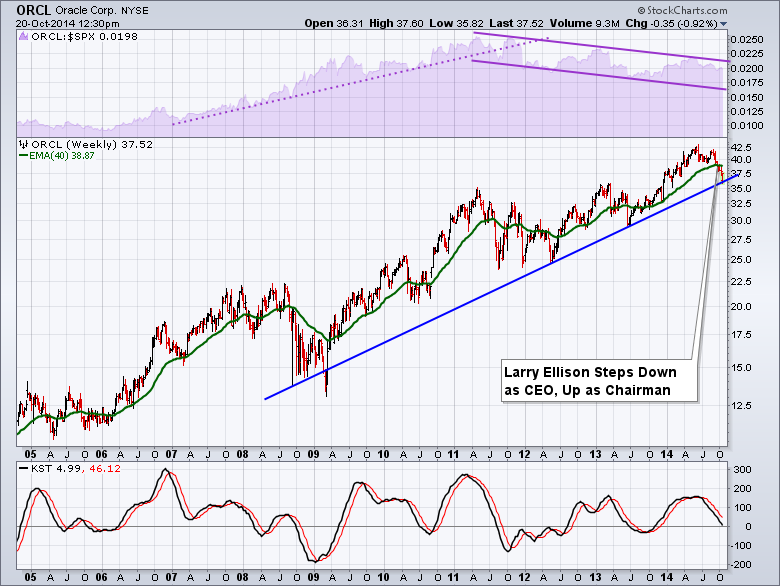
Here is a chart I posted a month ago in the Subscribers blogs for the Market Roundup with Martin Pring.(20140919) Market Roundup Oracle had under performed the S&P 500 ($SPX) for quite a while ...when Larry Ellison stepped down. Hummm, thats odd. We also had a chart of SAP in the same Market Roundup but more on that later.
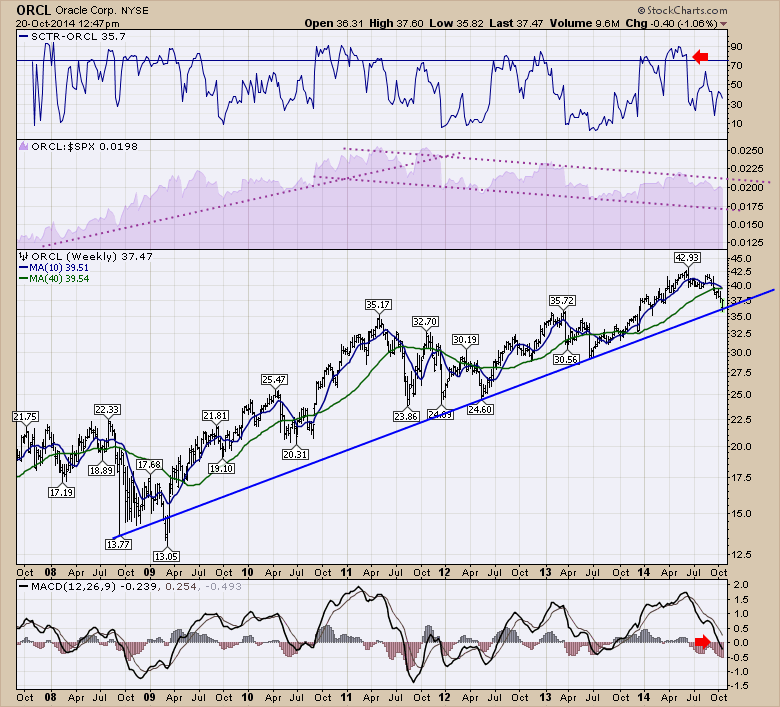
Well, here is the chart of Oracle (ORCL) with the SCTR and the SPURS or purple relative strength area at the top.We can see the stock has not been able to keep up with the $SPX in purple. We can see the SCTR ranking really started to drop in June when the highs were put in.
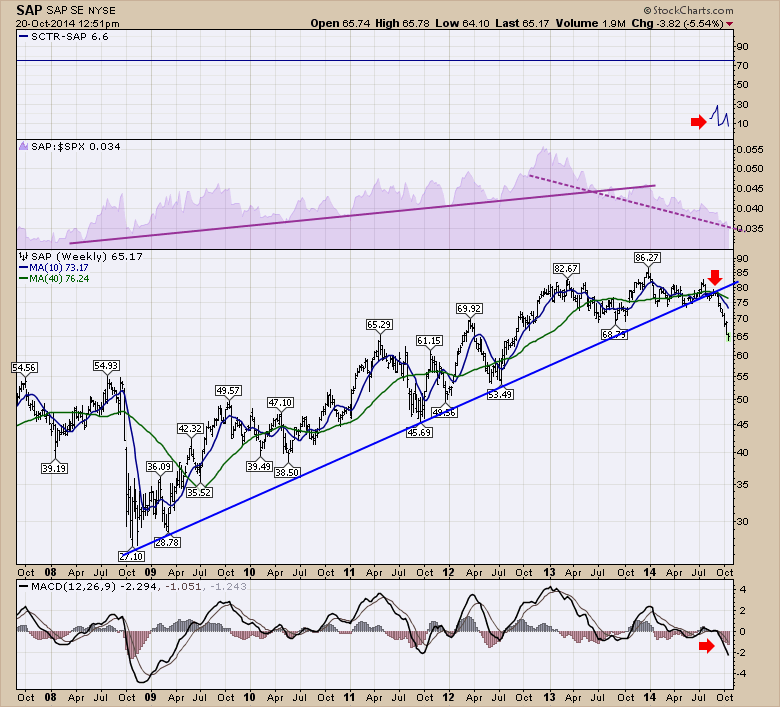
So here is the SAP Software (SAP) company chart. They just did a big acquisition. Hum, that was an Oracle strategy for continuing the revenue growth. SAP bought Concur Technologies the week the $SPX topped at 2019.
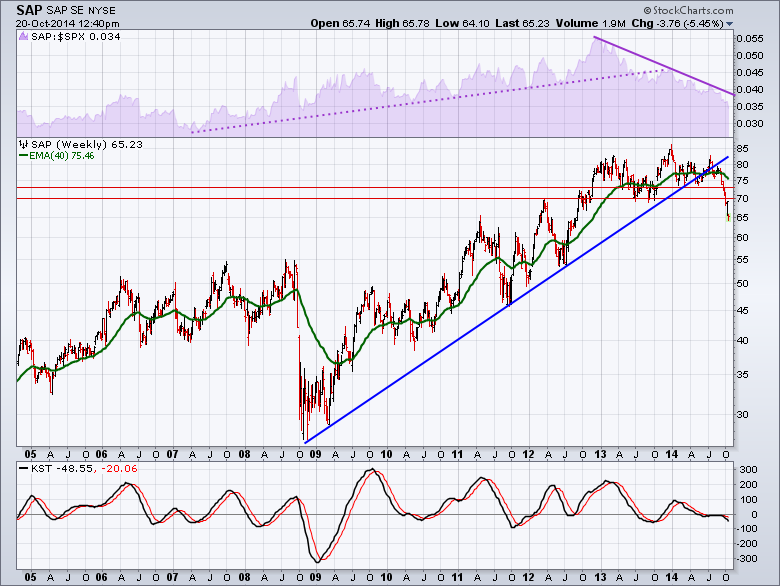
Here it is in the same view for SAP with the same settings. Under performing the $SPX and the SCTR is very low. The 5 year trend line is broken.
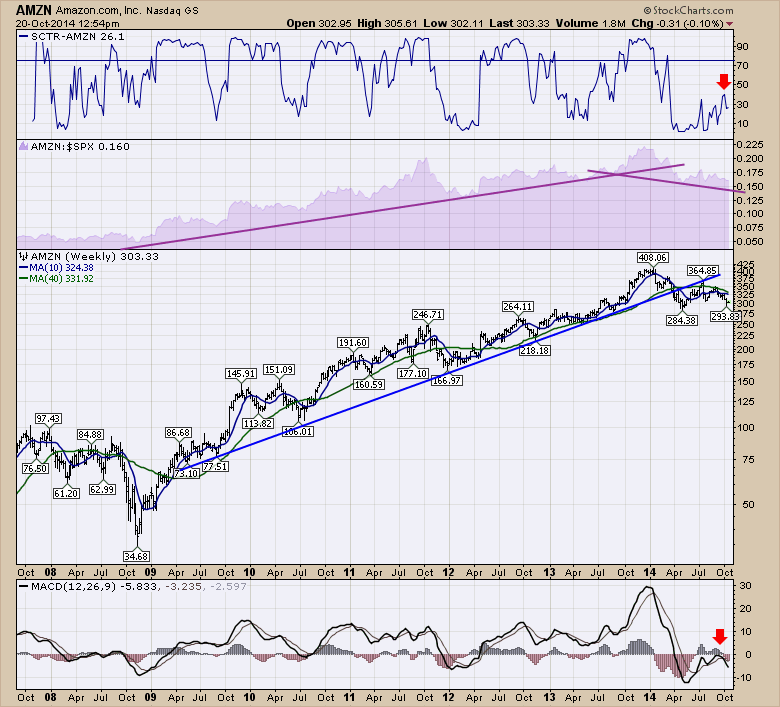
When I looked at Amazon (AMZN) which is also a large cloud company, here is what showed up. Same traits.
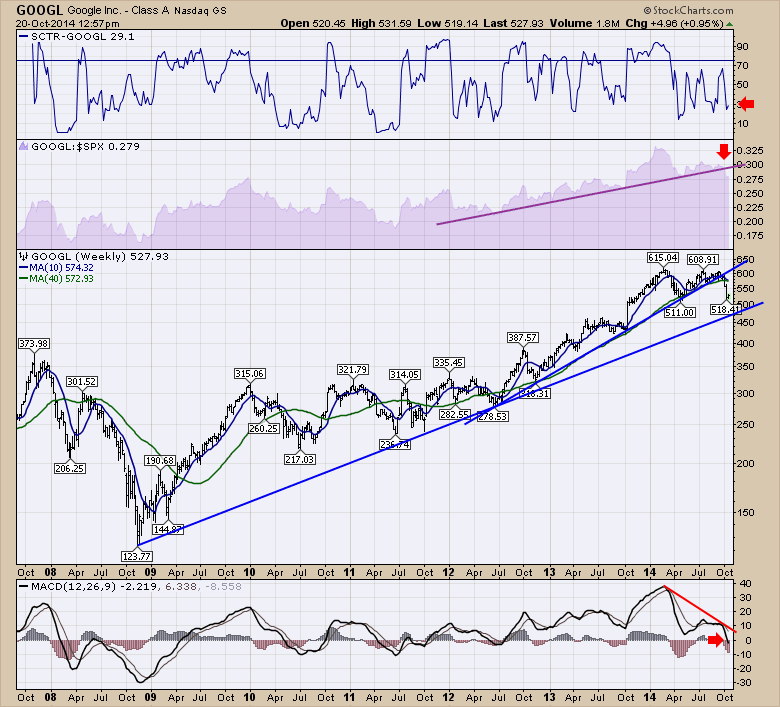
Here is Google (GOOGL). Same trait. Just recently broke the long trend line on outperformance compared to the $SPX. Look at the negative divergence on the MACD relative to the price. Double top in price, huge loss of momentum on the MACD.
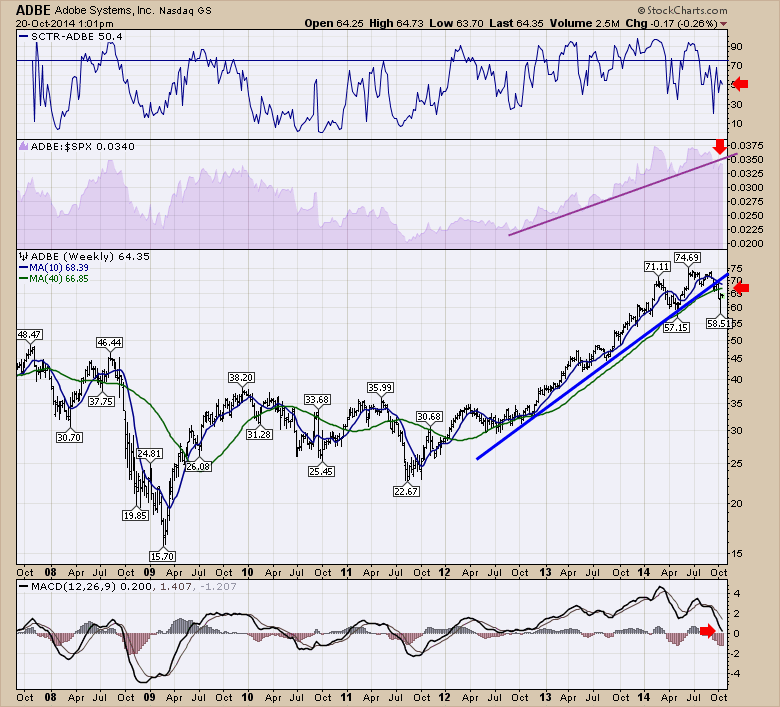
Here is Adobe (ADBE). I have been weary about their ability to produce gains for a long time. They kept proving me wrong. Today, this shows up in the charts.
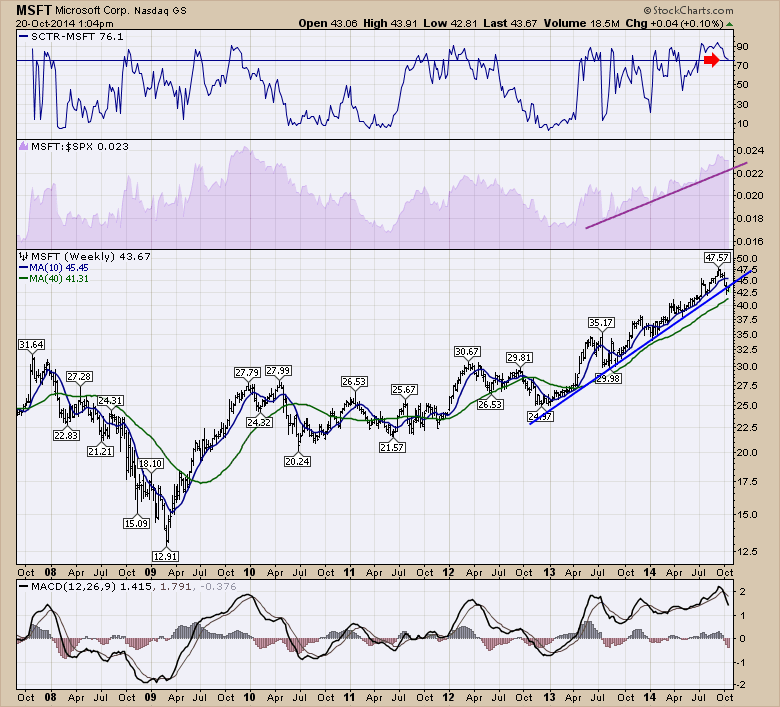
Okay, I have left room for a little optimism. Here is Microsoft (MSFT). Chart looks great. Be cautious on it starting to under perform the $SPX here. There seems to be a trend in the charts above that should infect MSFT at some point.
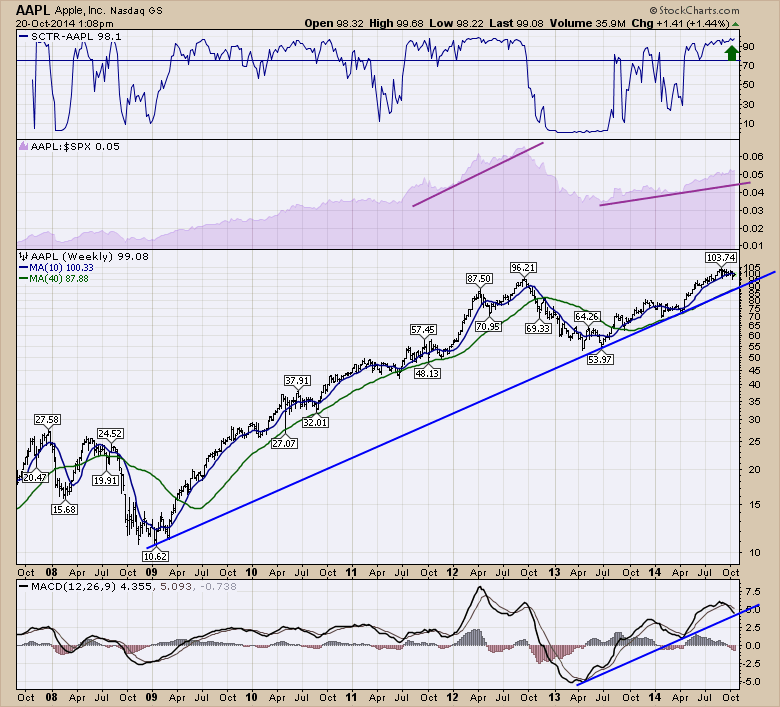
Lastly, Apple. While not a big industry cloud provider, definitely a leader in the XLK.
So, when I scan these charts, I get very worried about the broader trend in large cap tech. You should be able to click on these charts and see the settings. You can check out ASML, INTC, CSCO, QCOM, MU, PCLN, EXPE, EBAY, NFLX,P and see what you think. Looking at this list of charts would suggest to me being long the XLK without protection close below( Stops, Puts etc) is ignoring some very weak looking major charts. Lastly, it looks like SAP, IBM and ORCL are finding it very difficult to keep growing revenue and bottom line profits. But that is my view based on the charts, not the earnings calls. We'll know in the months ahead if this trend continues.
Good trading,
Greg Schnell, CMT


