This is the second article in a series of modern day Manias. Part 1 can be found here. The Year 2000.
2007 was a market top that will be remembered for a long time. It started with a market mania in the housing sector, created a mania in the banking sector and caused a series of events that fell like dominoes as they relentlessly tumbled one after the other.
Let's bring up the chart showing how the topping structure looked. Compared to the 2000 top, this market was remarkably different. The tops were still close to each other. The Russell 2000 ($RUT) made its top in July but the other three, the S&P 500 ($SPX), the Nasdaq Composite ($COMPQ) and the Dow Jones Industrial Average ($INDU) all topped within a few weeks of each other. The Dow and the $SPX as well as the Wilshire 5000 ($WLSH) all had the high close on October 9th and an intraday high on the 11th that was higher. The Nasdaq and the Nasdaq 100 ($NDX) both topped on October 31. However, in 2000, the Nasdaq pair both fell away quickly. In this 2007 market top, all the markets rolled over together with relative unison which made the top much easier to spot. It was probably still difficult at the time. That rollover move is tight compared to the 2000 top where they had a lot of sideways movement in some indexes while the others were making church spires. All the markets dropped at least 50% so that is huge. That means an investor needs 100% to get back to where they started. Notice the amazing similarity of all the price patterns.
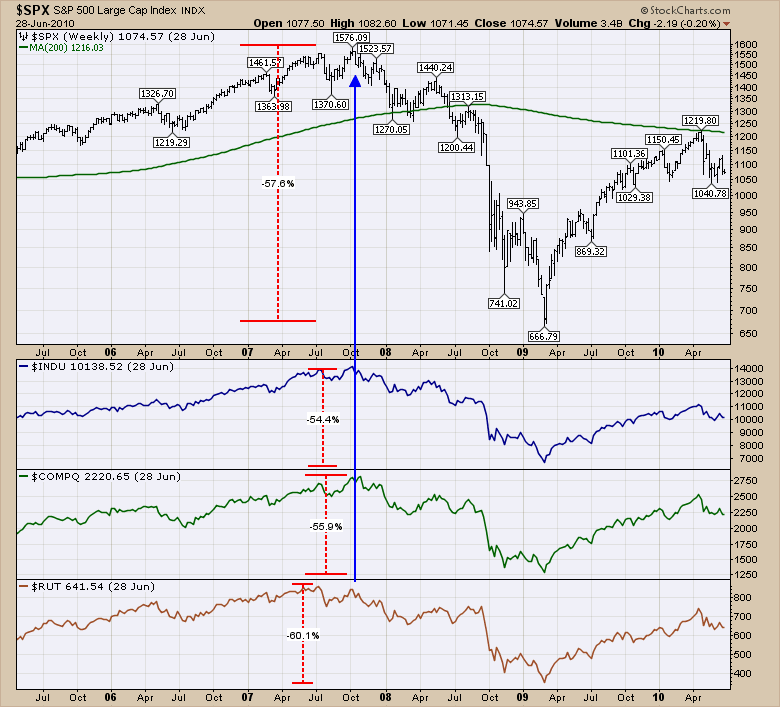
Chart 1
The oil chart for 2000 that I covered in Part 1 was really interesting. Everyone talks about how low oil prices are bullish, but it usually marks the end of a business cycle. A lot of the cycle charts show a run in the energy stocks as a good indicator of final market highs approaching. 2000, 2007, 2011 all had that trait. The price of oil made a spurious run into the 2008 top, but the stock market topped out long before the oil markets did which is odd. We can see the oil market went on for another 8 months. Immediately below the $WTIC chart, the panel shows the $USD was falling, which gave oil a huge tailwind blowing it higher. Again, everyone cited the high price of oil as a great indicator that everything was ok. Then when oil falls, they cite it as a big boost to the economy. Let's use the charts to help us decide what is going on.
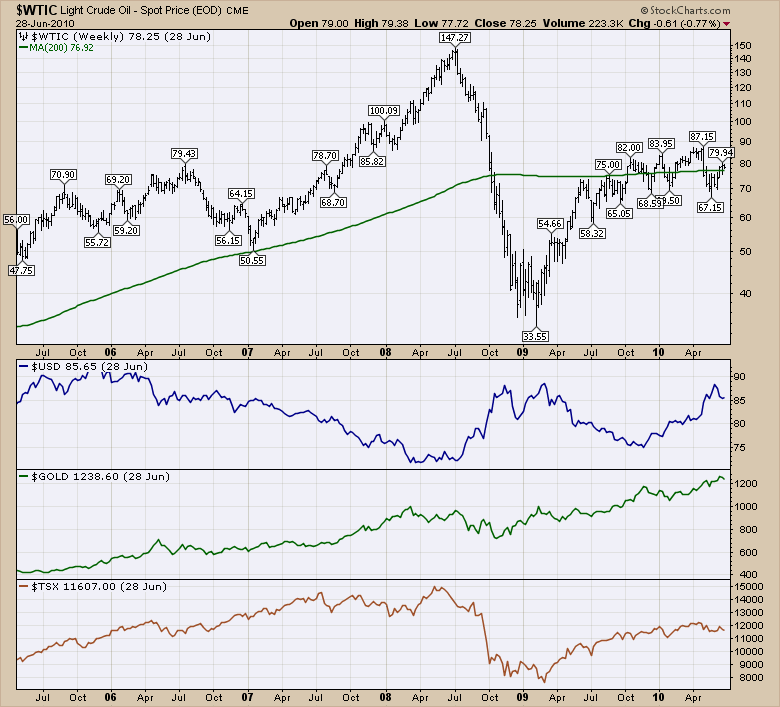
Chart 2
$GOLD was in a big bull market with a falling $USD as shown on Chart 2 above. The 2008 correction in Gold was big. It fell about $400 which on a $1000 spot price was very painful. In the lowest panel is the Toronto Stock Exchange. Surging on the back of the commodities, the $TSX continued to have a giant tailwind. Eventually the subprime started to erode business confidence and consumer confidence causing the economy to slow down in the US. The commodities continued to run, but eventually they fell too, pulling down Toronto's Exchange. Commodities are the last to get going in a new bull market, and the last ones to top usually. I'll show two different market cycle models by Sam Stovall and Martin Pring that lay this out after I finish with the charts specific to this time period.
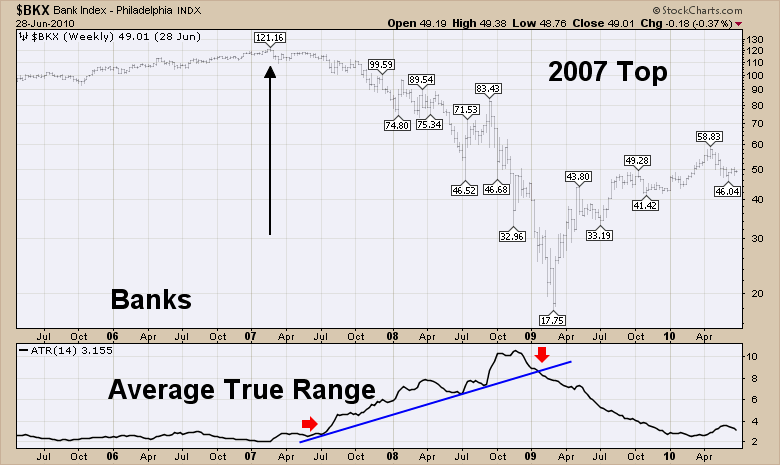
Keeping with the same charts as Market Manias Part 1, let's use Chart 3 to review the banks with the railroads, trucking and autos. So the banks were part of the subprime crisis. It was the absence of lending standards on mortgages that let the derivative ridden subprime loan bundles valued as "AAA' really send the housing into a parachuter's nightmare ... free fall with no parachute. The banks dropped quickly in early 2007 after the big new high. They fell 10.1% and then held that level till after the July stock market rally. The comparison from the Year 2000 to 2007 is interesting. They didn't really oscillate at all in 2007. They just slowly let go. In 2000 they oscillated sideways in a wide range from 1998 to 2002. 2007 was different as they dropped below the 40 WMA and just never regained it in perfect falling market style. Notice how the intra-week volatility changed from being very small on the far left. As you go past the high, then it really started wide swings below the 40 WMA. As it went lower, the volatility picked up with each group of weeks building wider ranges. We can plot this dynamic by plotting the ATR. We'll do that later on in this article to help us understand when markets are losing their normal trading range. The real story here was lower highs and lower lows writing the script for a downtrend. There is so much to learn from history.
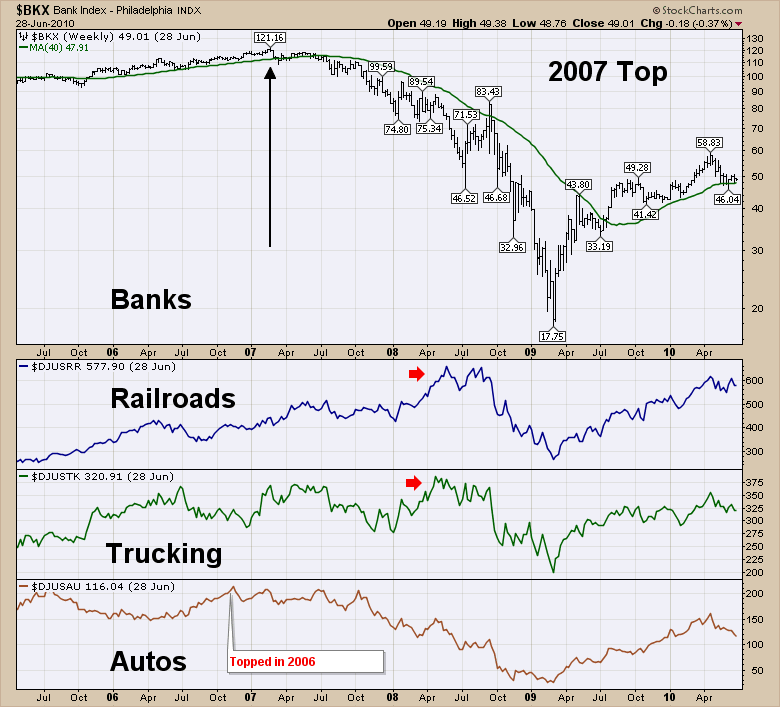
Chart 3
I could have used the transportation index ($TRAN) on Chart 3 but I am learning something here as well. So far, in both 2000 and 2007 the trucking and railroads were not good indicators of market tops. Autos were a better indicator of weakness and they are in the Consumer Cyclicals sector, not in Industrials with the Transportation stocks. So the railroads and trucking look like they follow crude more than they follow the economy. In 2000 - 2002 the railroads and trucking made higher highs throughout the downtrend! Who knew? Hindsight is nice, however the trucking index pulled back in 2000 about 30%! Look at the 2007-2009 period. Railroads were strong until Crude rolled over. Same with trucking. They both fell in sympathy with the major top in the Commodity group. As a matter of fact, their price action almost mirrors the price action of the Canadian Oil and gas producers at the time. The charts above show the Rails and Trucking bottoming the first week of January. The Canadian oils bottomed the 15th of January 2008 and went on a ballistic run while crude went on to $149. But look how good the Autos were at indicating weakness. They levelled off most of 2007 while the $SPX kept climbing. They started to make lower lows and kept retesting the highs but it was a sign of weakness. Sometimes it resolves to the upside like the Rails and Trucking were able to do into 2008, but the Autos told the story of economic weakness best in both cases so far with the benefit of hindsight.
Let's put up Chart 4 of some homebuilders. It was there that the tragedy began. We'll start with this well timed article from the NY Times, which interestingly enough, was October 2005. We can see they were decimated. Lots of them were down 60% within a year. But the stock market band played on. It was not until the financial structure around this came tumbling down that the real market response happened. On each chart I scaled the size of the price drop. Humbling to say the least. It must have been an unreal amount of pressure trying to refinance the company complete with all the land holdings they had. So the housing sector let go well before the auto sector. The banks were in there and they really did not make a run to new highs in the fall of 2007. Because of the size of the mortgages, it really was a big pullback.
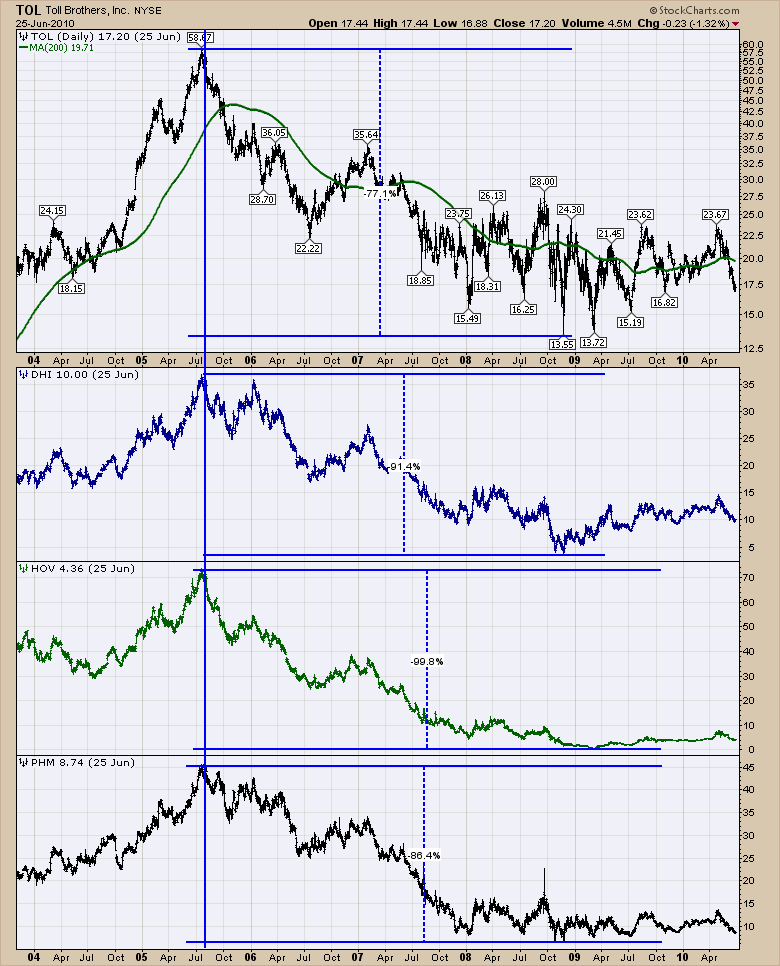
Chart 4
We talked about the volatility of the banks. We could use Autos or just the stock market itself. One thing that I find helpful is when the ATR or the Average True Range of the stock starts to get real wild relative to history, it is time to be more cautious. So the ATR is a simple calculation that measures the height of the intraday move from high to low and keeps track of the average over a period of time. The default is 14 days so we'll leave it with that. You can see on this ATR calculation it was between $2 to $3 for years and then it starting increasing in size. So a big increase in the ATR should be viewed with some scepticism.
Let's look at the same chart with the Autos.
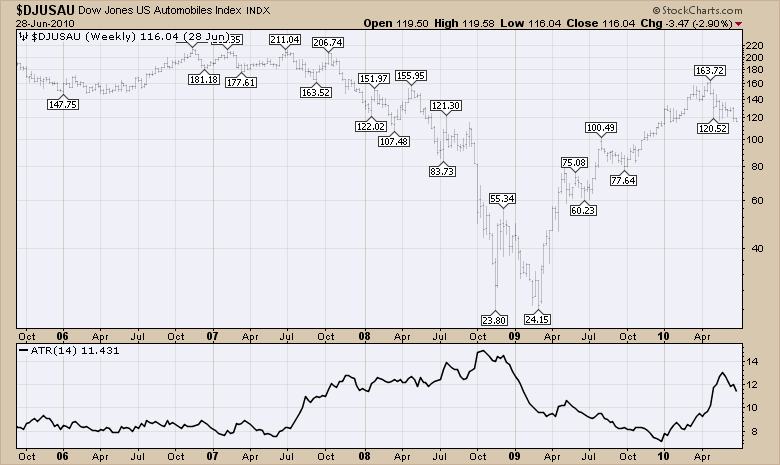
This looks like a pretty good tool. Nothing is always perfect but this makes some logical sense. If people are getting less sure about the industry the trading range widens as some are willing to sell lower as they see changes in the business. On the other hand, the trend followers thinking they have got a nice sizeable discount when it is making lower lows.
OK. I promised the Sam Stovall cycle chart from the S&P's Guide To Sector Rotation which can be found at the bottom of the PerfCharts page on StockCharts.com. The purpose of posting these next two charts here is to help you evaluate how these markets behave relative to the business cycles. Obviously, an entire book could be written about this century's Manias already!
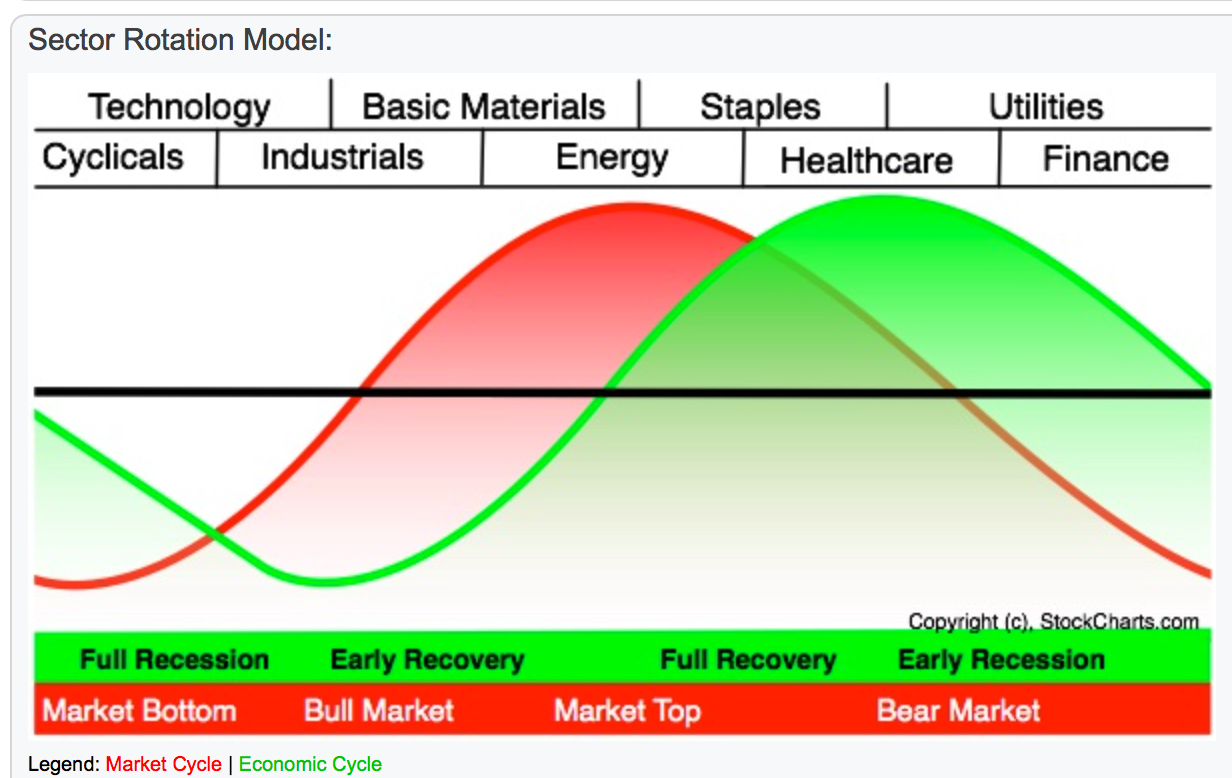
For Sam Stovall's chart above, the red line is the stock market cycle, the green line is the economy. The market senses the bottom of the economy before the reality of the bottom is in. Over a complete business cycle, different sectors will have leadership as the cycle moves from the left to the right. You can see when Energy tops, that is usually a market top. So far that is true in 2000 and 2007. As a matter of fact, the energy sector was late in 2007 as it didn't top until mid way through 2008. However, it did have a major run into the 2007 top, then a pullback to January 2008 before going into the ballistic mode for the final run.
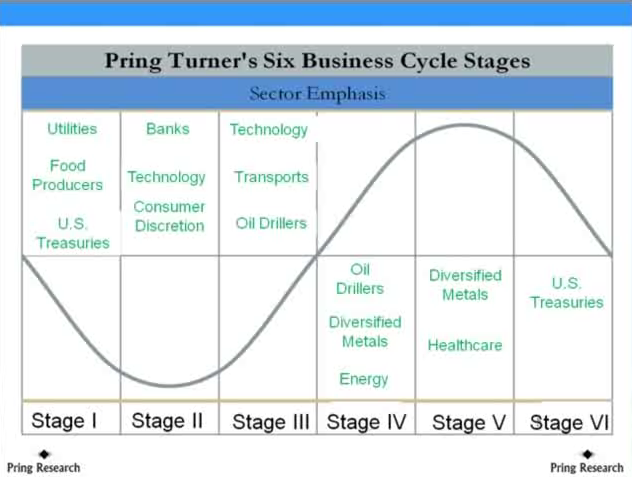
Below is Pring's Business Cycle. When the market is rolling along, this defines where the best investment opportunities are during each stage of the cycle. You can see Energy is not the place to be right at the top. It was the place to be leading into the top and when energy rolls over, usually that is an indicator of the economic cycle. With modern day distortions these are fuzzy guides to help us make sense of it all.
For more information on this sort of cycle analysis, I recently wrote a blog on the subject. Are There Any Clues To A Top In A Sector Rotation Cycle?
I have another chart to add with the Google trends tool. When there were certain manias, it became all the buzz in the street. So we can search for specific terms to see if they were as widely believed as a typical mania might have it. This is an example of search results that I found. The word Subprime had gone ballistic very early in 2007. While the term was searched around the world, it was really concentrated in the USA shown in dark blue. The funny part is, it didn't knock over the stock market until 9 months to a year after that.
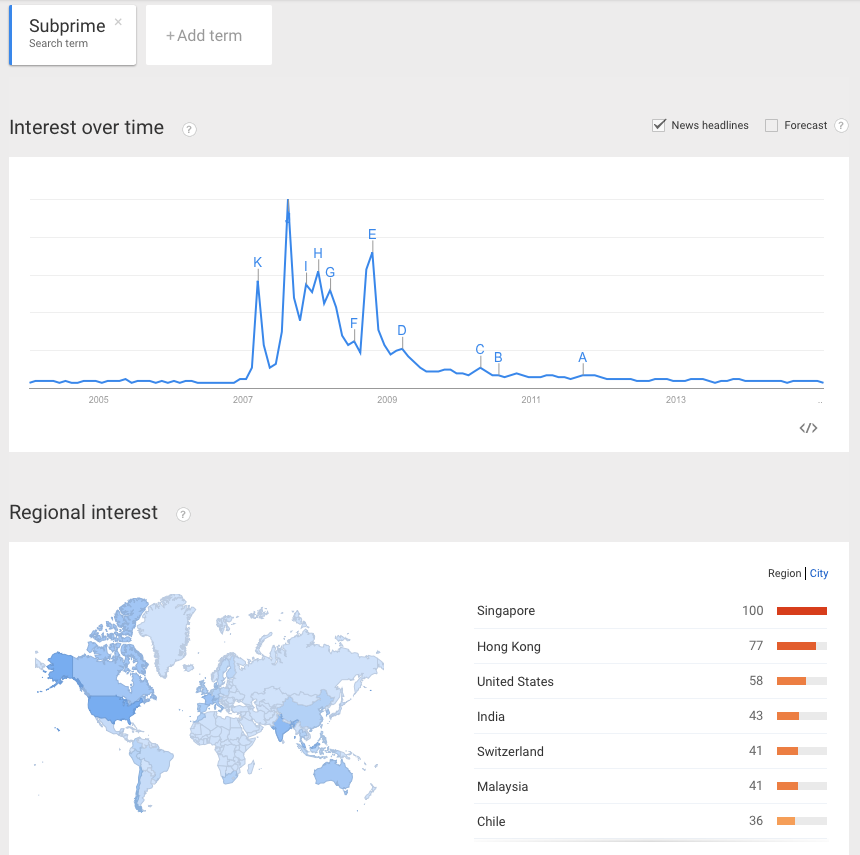
Now the simple analogy of the popularity of a search term can't be that important, can it? Well, my thinking around it is that until it reaches a certain level of consciousness in the population it can't be considered a "Mania". So this helps discuss the breadth of the subject across the population at large. The checkbox on the upper right shows it as a News headline. So we have another tool to help assess the importance of the issue in modern times. Thank Google for the Google Trends tool!
I try to cover off some of this information in the webinar series I host every Thursday at 4:30 EST. The registration link can be found on the What's New section of the homepage and at this point in time, it is open to everyone, not just subscribers. Click here to Register for Thursday January 29th, 2015. In the next article, we'll cover the Commodity bubble of 2011. Seriously! Another "Mania" so close to the last one? Yes. It was in my eye. We'll see if you agree when I write it all down in Part 3.
Good trading,
Greg Schnell, CMT
