Currently, the $USD high is January 26th, 2015 which is 2 days after the ECB started QE. Would the ECB announcement matter? Chart 1 shows the current situation.
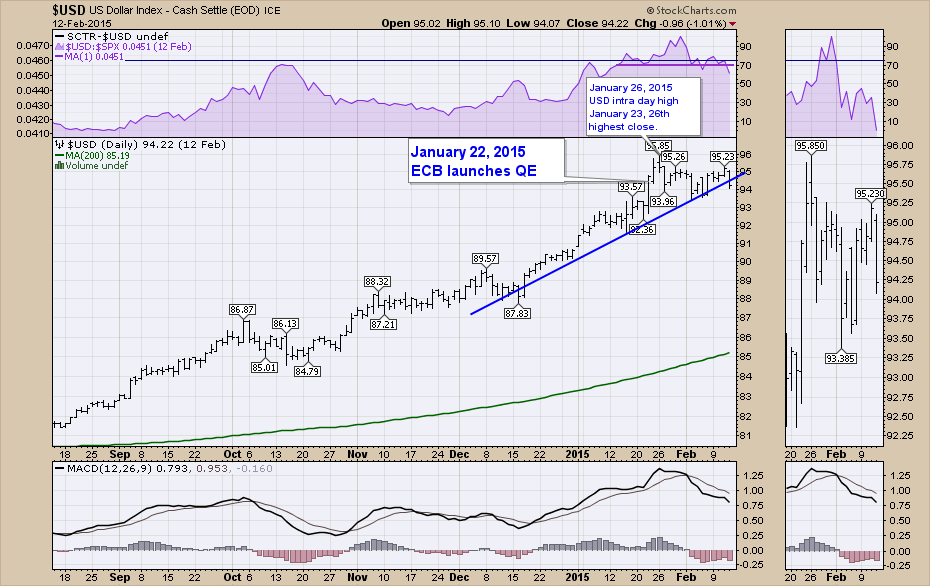
Chart 1
Back in 2012, the $USD fell for about 35 trading days after Mario Draghi's "Whatever It Takes" announcement. Chart 2 demonstrates that. So the recent price action on the $USD and the breaking of the trend line on February 12, 2015 could be concurrent with money movement towards the eurozone.
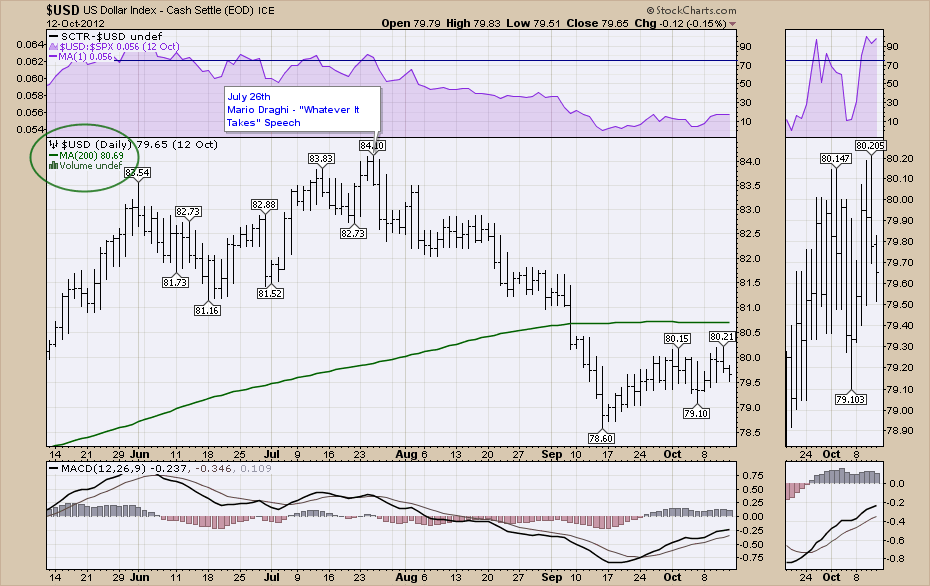
Chart 2
I think this is pretty compelling that we need to be aware of the actions of the ECB.
Now let's reverse the dates, stay on 2012 and look at the Thirty Year Bond Yield ($TYX). Chart 3 shows the 2012 chart for the $TYX after the Mario Draghi speech "Whatever It Takes." Yields rise as prices fall on bonds, so as this chart goes up, investors are selling their bonds for less.
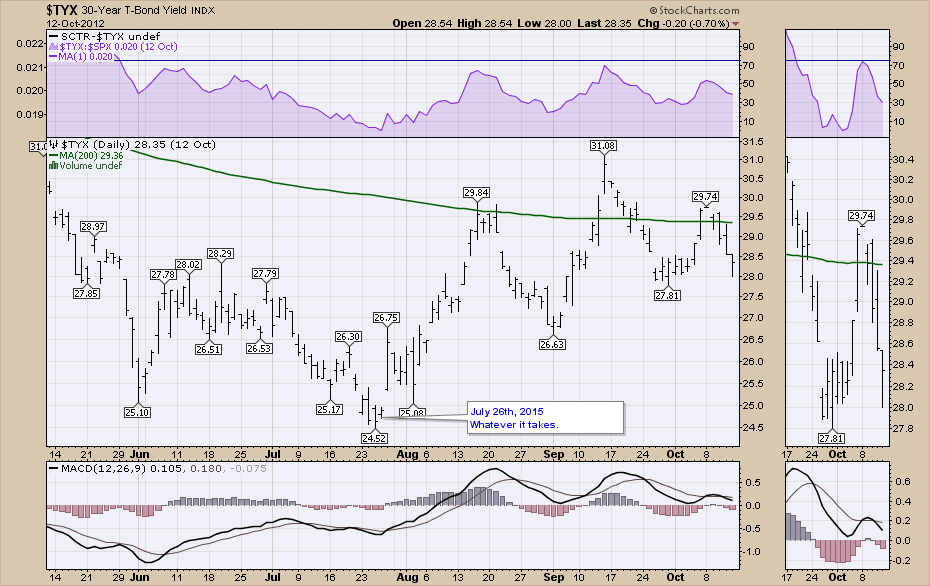
Chart 3
Just to make the point for reference from the chart above, the US bond market bottomed July 25, 2012, the day before Mario Draghi mentioned 'Whatever It Takes'. The same dates apply for the US ten year ($TNX).
The current low in the US bond market ($TYX) is only 6 days after the ECB QE announcement. $USB bottomed January 30th so far, so this is still early days. Here is Chart 4 with the current yield chart for the 30 year ($TYX).
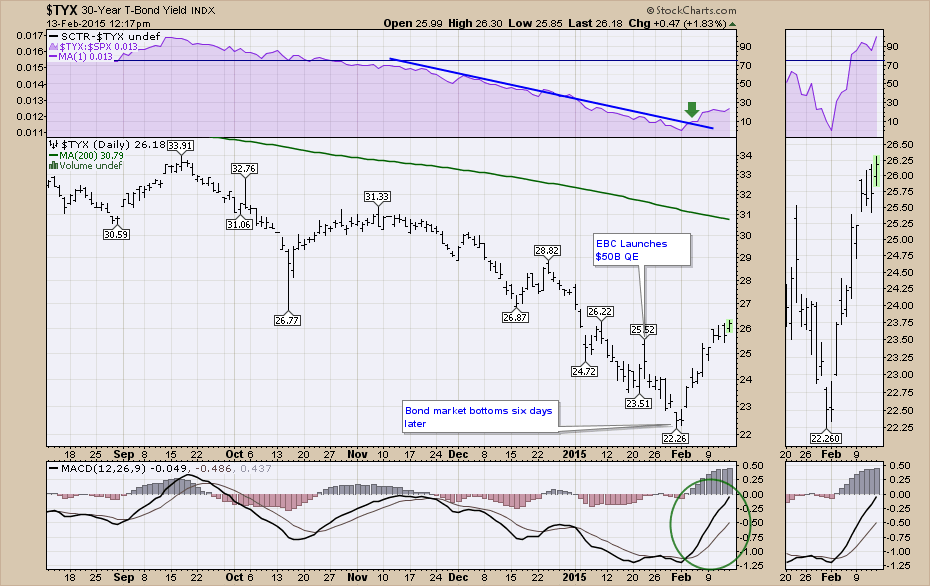
Chart 4
Investors may want to re-evaluate their bond portfolio at this time. Other interest sensitive products could also move dramatically like utilities shown in Chart 5.
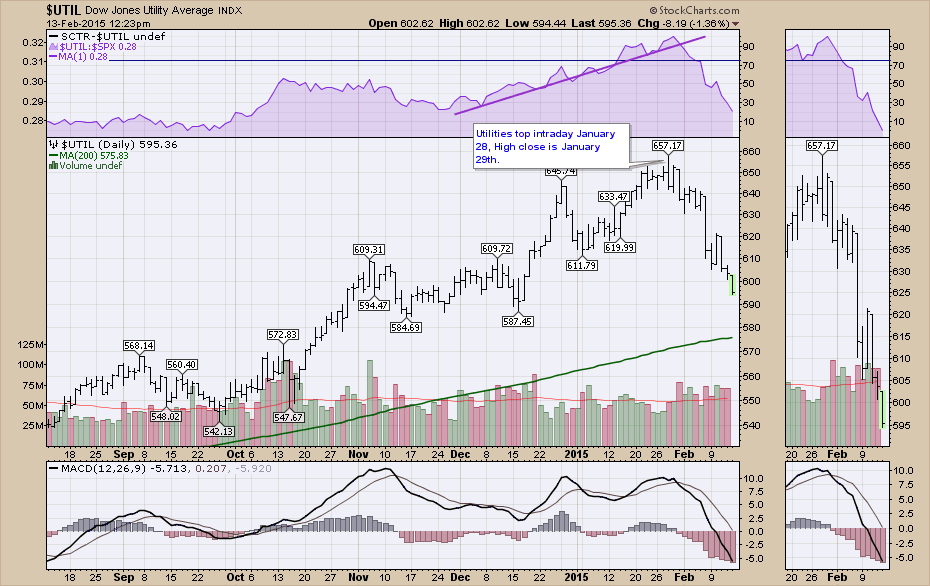
Chart 5
Ok. Enough about what is going down. What goes up when the $USD falls? Commodities...This might be a good weekend to fall in love with the commodities stocks. That Valentine's Day romance might be sparked by falling in love with some commodity related stocks! Oh boy. How will I explain that to my wife? I can't end it there. $LUMBER related looks great. Oh, can't leave it there with a 2 x 4 ending. Commodities miners like Teck. Here is the 2012 chart. EFA is breaking out as we have been talking about for weeks. Consumer discretionary like autos looks good. Large Cap Tech is also great. Anyway, it looks like a good weekend to fall in love!
If you need some viewing on Saturday morning, Martin and I did a very informative webinar on Thursday, February 12th, 2015. Sports, home shows or very exciting videos brought to you by Martin and Greg! Too cold to golf here!
Perhaps I got the title wrong. It looks like a pattern we have seen before. $USD & $TYX start the sequel. Have a great long weekend.
Good trading,
Greg Schnell, CMT


