Trican Well Service (TCW.TO) announced earnings today. The company described a stunning change in business which could threaten the debt covenants as soon as this fall so the management stopped the dividend this morning that was introduced in 2006. The picture below from the Trican website identifies the businesses that they are involved in. They also have excellent videos on their website explaining the processes in the energy business generally.

The oilfield service industry group is really in a bind.
Gasfrac, a relatively new company already went down, but they were using a relatively new technology that didn't get traction. The financial results announced by Trican are significant as they are an experienced, very aggressive player in the industry. Some of the statements in the financial results are stunning. From the end of 2014 to the end of March 2015, a 3 month period, they idled 50% of the US fleet. For Canada, in March alone, they decreased fleet activity 35%. March marked the current low in oil. Layoffs numbering over 2000 in 3 months. The number of client jobs billed dropped from ~6400 to ~3600 from March 2014 to March 2015. Debt covenants are threatened by the second half of the year so they are working to bring those back into line. Let's look at the 7 year weekly stock chart now that the market has opened.
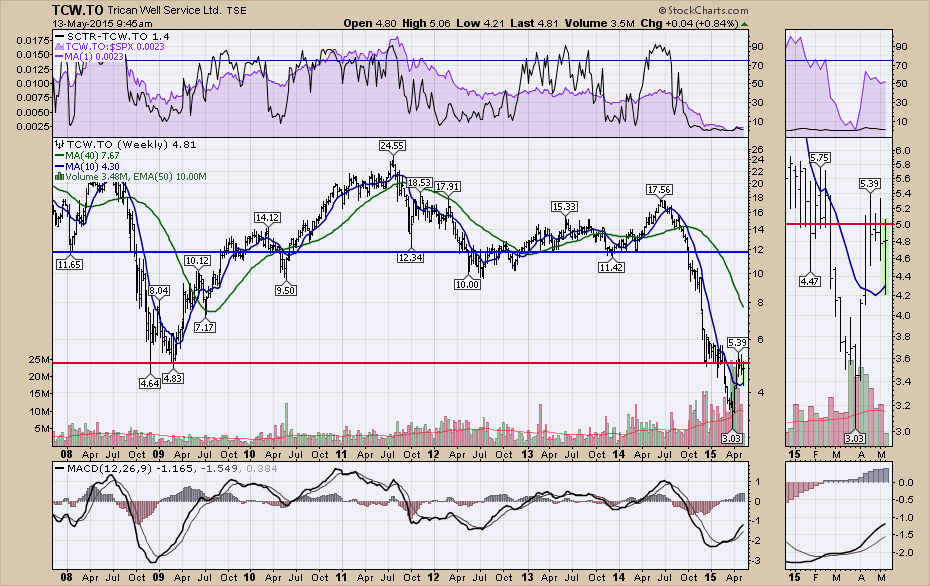
Chart 1
In Chart 1 we can see the shares sold off even more than the financial crisis where oil went down to $32. This is very severe. I have drawn a red line at $5 which looked like support in 2009 and late 2014. Buying beaten down stocks is not for the faint hearted. The SCTR ranking is 1.4% which means there is another 1% of the stocks that are behaving worse than this one. The SCTR is screaming avoidance. Two things are somewhat hopeful here.
1) The stock is holding above the 10 WMA or 50 DMA shown in blue.
2) The momentum on the MACD is rising from deeply oversold. The extreme volume of 20 Million shares per week for 4 weeks does seem to mark the lows at this point. If you look back at the 2009 lows you can see a spike up to $8 and then the stock made a lower low. The MACD in this case looks healthier as we are already 5 months off the momentum lows. We have a nice positive divergence between the January lows and the April lows. However, price could still trade lower as the MACD rises giving you another positive divergence into the summer.
Let's roll into the daily chart on Chart 2. Trican has broken all of the downward momentum and is now base building. We can see the positive divergence on the MACD. This is a very important place on the chart for the MACD. If it rolls over here and continues down below zero, this would be very uncomfortable. If the MACD can make a higher low above zero and turn up, this stock could probably start to generate some momentum and climb above the $5-$6 area. The purple SPURS in the top panel shows the stock is tracking with the $SPX as shown by the horizontal line. If TCW.TO could break higher on the SPURS, this would probably allow investors to join in an uptrend. It is important to realize that the SCTR implies that an investor buying at this level is expecting great things from one of the worst performing stocks in the market. Turnaround cases can be very profitable, but an 18% swing from yesterday's high to today's low suggests a mega pack of Tums are in order.
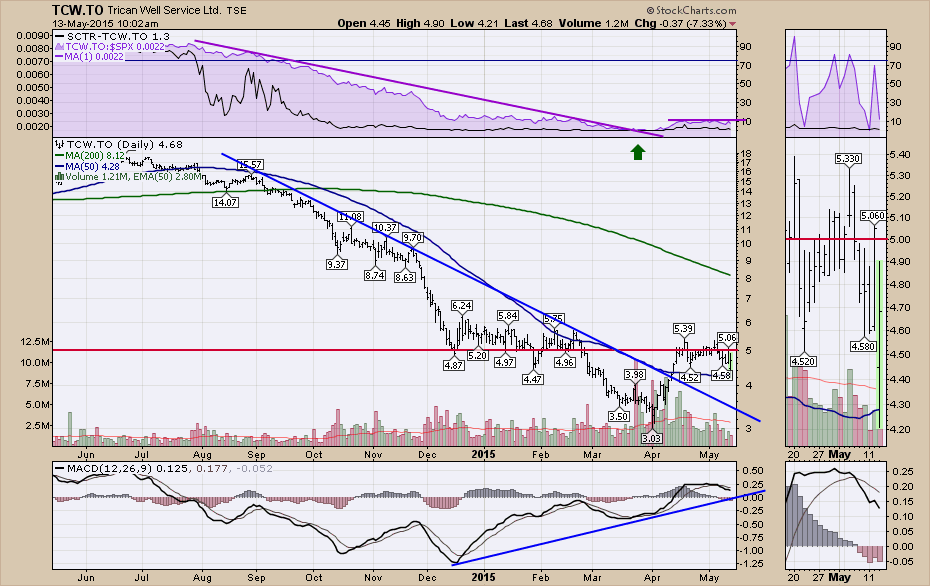
Chart 2
Trican is affected by both oil and Natural Gas being below marginal production costs. Natural Gas is still 20% below marginal costs but the chart of Natural Gas is perking up off the $2.50 base we have been talking about. The chart of oil is showing caution. Tomorrow on the webinar, I will go through a lot of the commodities. I will be joined by Martin Pring. We have a new format for the webinar so we will be trying that out. I look forward to having you join us. Follow this link to register for the webinar. Greg and Martin.
Let the TCW.TO stock settle using the three day rule. The drill down on Trican looks like the worst is in. If 15% daily volatility is no big deal, Trican is interesting. Today's low is the exit if I am wrong. The real question one has to decide is if you want to play in beaten down stocks or the strongest stocks. The SCTR suggests the former in this case if you are interested.
If you would like to get these articles direct to your email, follow this link and click subscribe in the top right hand corner to email or RSS feeds. The Canadian Technician. You can also track me down on twitter @schnellinvestor.
Good trading,
Greg Schnell, CMT


