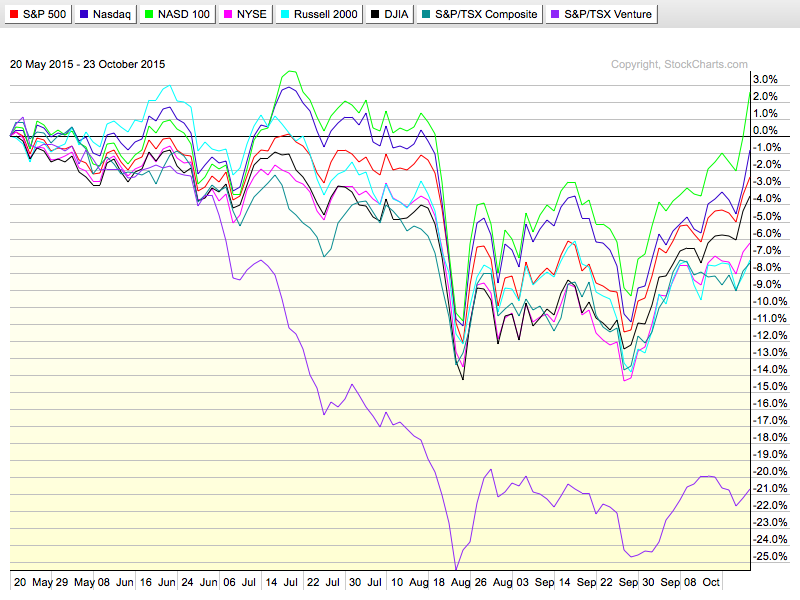
Every TV station is gasping about the great run-up in stocks. From BNN to Bloomberg, everybody is talking about this October being the best for stocks in 4 years. The US market really popped last week ($100 Billion) between Amazon, Microsoft and Alphabet. That is a step change. For the broader market, it has been much more subdued but we still have two huge weeks of earnings to work through. Looking specifically at Canada, we need to do some major work to get some confidence back into the stocks. On Chart 1, you can see the $TSX underperformed the venture exchange since the September low. A large part of the $TSX underperformance is Valeant fainting from an overdose of financial reporting questions.
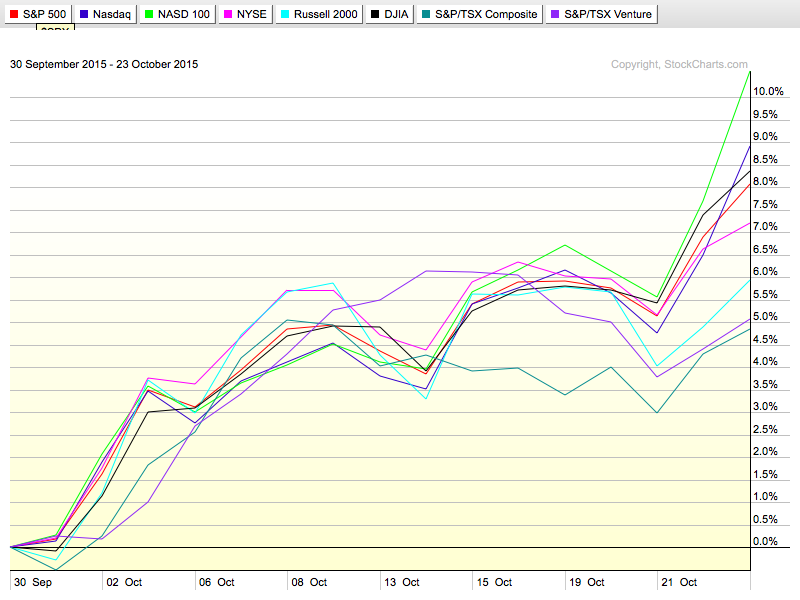
Chart 1
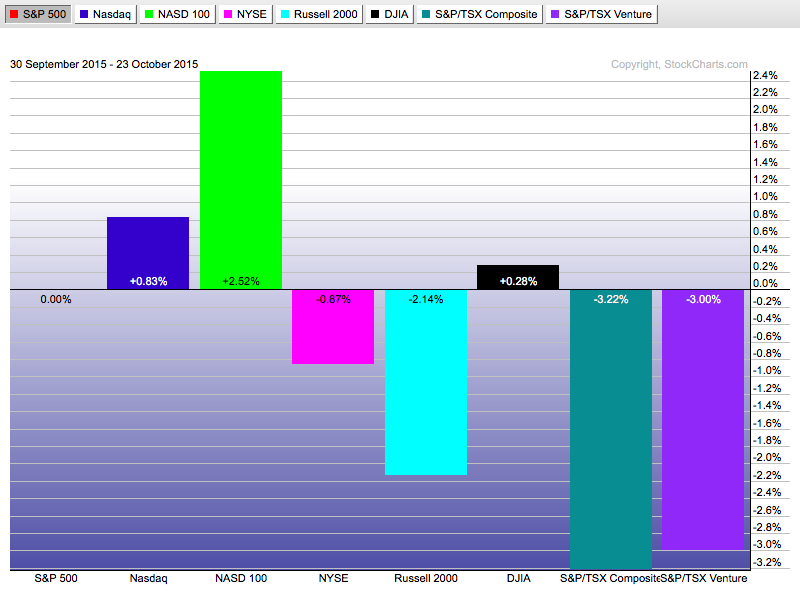
In Histogram mode, it looks like this. I have made the $SPX the zero line (the tab at the top is grayed out), so everything is compared to the $SPX. The $INDU and the $COMPQ are in line, but the Nasdaq 100 Index has clearly rocketed higher.
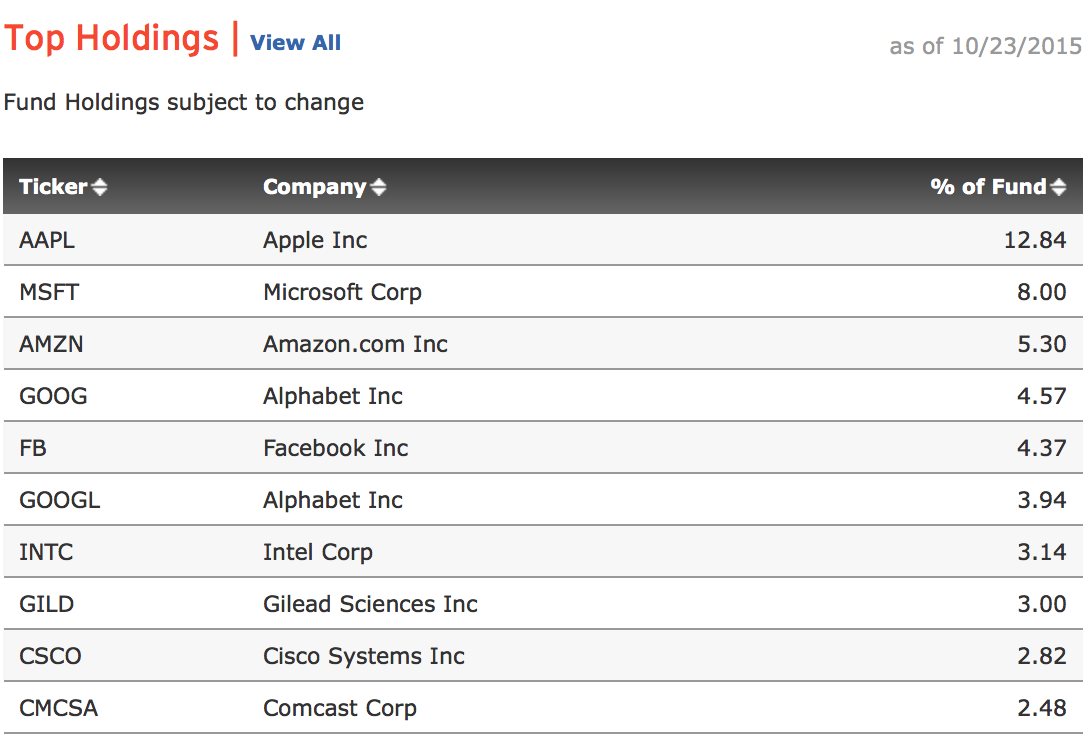
These are the top 10 holdings of the NASDAQ 100 ETF (QQQ). The top 10 make up 47%. When Alphabet, Microsoft and Amazon all reported on the same day, it really changed the relative performance.
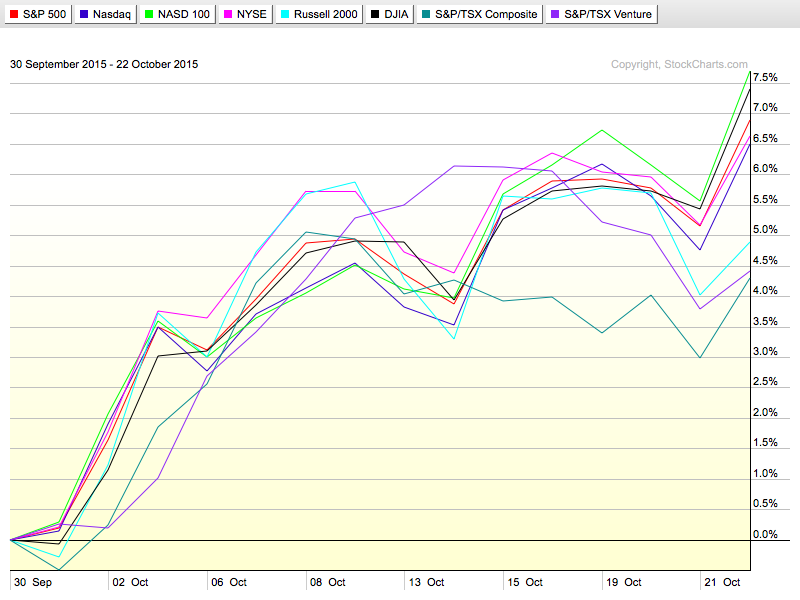
For reference, here is a chart from Thursday's close before the earnings release on Thursday night. Mario Draghi had hinted at more QE so Thursday was a big up day. Between Wednesday night when the green line shows the NASDAQ 100 at about 5.56%, Chart 1 above shows the NASDAQ 100 currently up 10.6%. A two-day rally of over 5% in one index! The 3% difference was dominated by the stocks of AMZN, MSFT, and GOOGL.
The point I want to make here is the big numbers look great, but there is very little breadth.
- The number of stocks trading above the average for the index is 39 of 109 stocks. Yes, the NASDAQ 100 has 109 stocks. So roughly a 4/11 (39) to 7/11 (70) ratio and the big ones are the great ones.
- 12 of 39 outperforming stocks have an SCTR today less than 50 even after the bounce and outperforming the index for almost a month.
- Of the 39 that outperformed since the low, only 20 had an SCTR greater than 50 at the September low. That would suggest 20 strong stocks have been rallying better than the index average.
- As an example, WYNN currently has an SCTR of 4.5. This is a very weak stock bouncing more than 11% off the low.
Taking a longer timeline, we can compare vs the May 20 high on the $SPX. This is the actual return from all indexes since the high. The Venture exchange in Canada is by far the worst. The $TSX is the next lowest, but the Russell 2000 is right there with it.
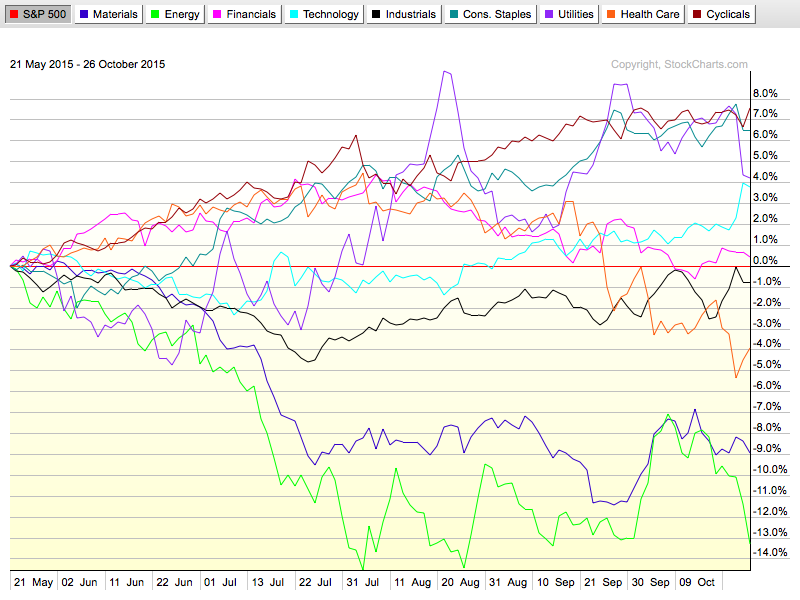
So while the exuberance appears in the indexes, I am worried about the underlying. Consumer cyclicals and consumer staples lead with smooth uptrends throughout the chart. Technology shot up last week and Utilities have really moved sideways. The $SPX is the horizontal line. Rolling through the sectors, it gets more messy. Healthcare in orange is drifting lower. More worrying is the financial sector in pink doing the same. The healthcare and finance sectors topped in July, but they were some of the leading sectors. The technology sector looks like the new home of fast money, whereas consumer cyclicals shown in brown has not really gained compared to the $SPX in the last month. Having utilities and consumer staples lead is a defensive structure. The balance sheets and growth of the large-cap tech companies are also a defensive place to hide currently. While Netflix is not as robust, Amazon's move to web services is spinning off money and Facebook seems to be able to generate cash by tweaking a few items. Perhaps we need to move the acronym from 'FANG' to 'FANAMA' now after this earnings report. Facebook, Apple, Netflix, Alphabet, Microsoft and Amazon would make that work.
Moving to Canada, we really struggle compared to the $SPX. Materials (gold and Silver) jumped up off the lows but have performed flat with the $SPX over the last 2 weeks. Energy surged and is now pulling back.
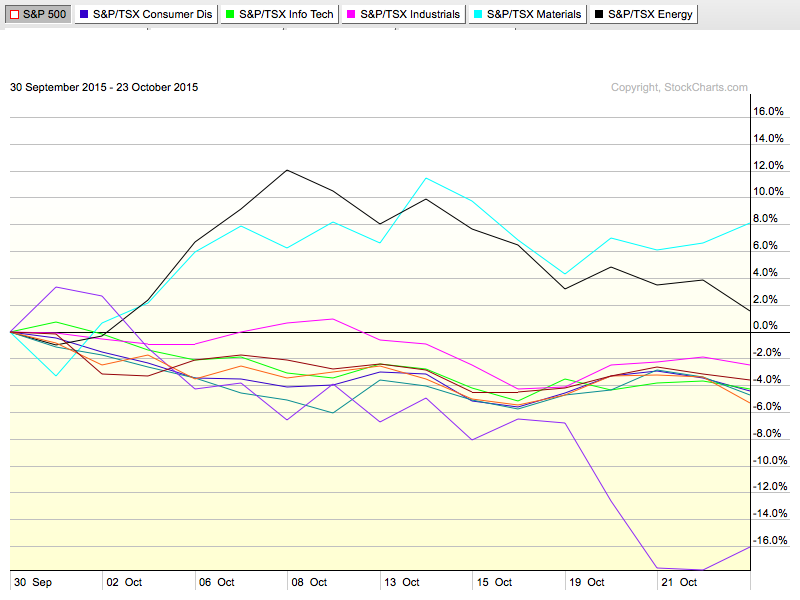
We really must be cognisant of the energy and materials coming into the end of the year. All of these companies will have their assets marked down because of the lower value of the commodities. This will show up in the financial statements, mostly in the fourth quarter and some may spread it over the 3rd and 4th quarters, but it will be accounted for. This will dramatically impair the ability to borrow. It is already being taken down as the banks don't wait for the financials to be reported, but the bottom line is the value of the reserves will be a huge change. The heavy weighting on those two sectors that currently appear to be outperforming could be misleading. Be careful expecting returns based on seasonality when all of this accounting comes home to roost on the financial statements.
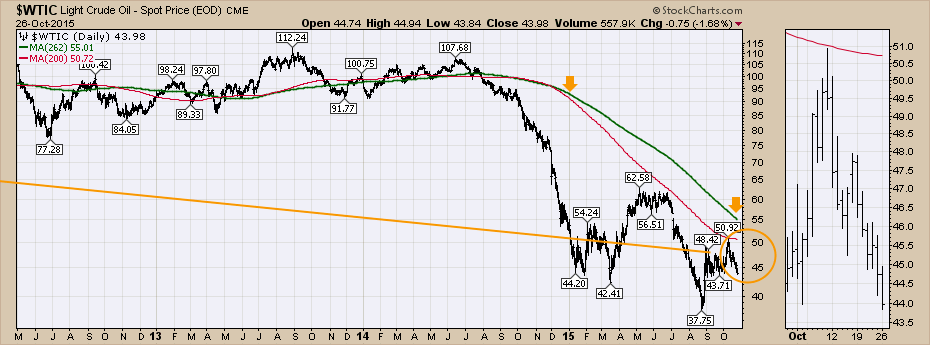
As an example, here is the data for oil. If you use a full year as 262 days (some use 258), you can see that in 2014 the year-end average was $93. This year, with approximately 200 trading days gone, the red line shows the average to be less than $51. We had a similar shock in 2009, but by year end, the spot price was trading well above the annual average so things were not as desperate. Now, it is dramatic and the price is currently trading $7 below the very low average.
Here is $NATGAS on the same chart. We can see that the averages were this low back in 2012, but look where the price was at year end then, and now look where the price is. Marginal production costs are around $4.00.
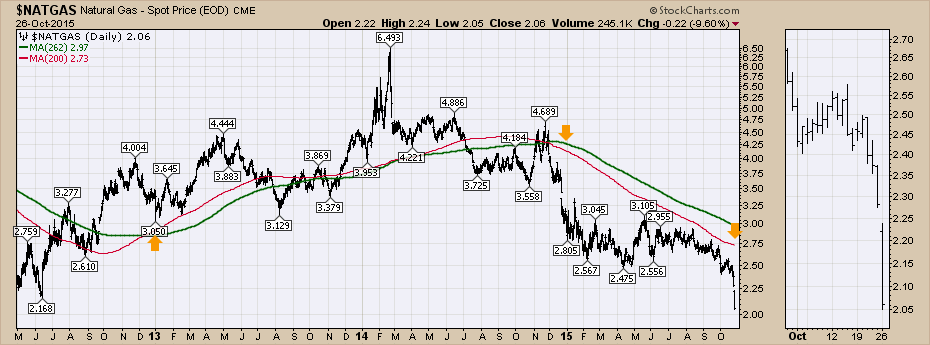
So with the Healthcare sector falling out of bed, $NATGAS falling off a cliff and $WTIC basing in a zone below profitability it looks worrisome. The metals charts look the same and have the same reporting issues.
My take is to be very selective going long here, as the large-cap technology stocks are covering a lot of trouble beneath the surface.
I'll have a lot more on the Canadian Technician webinar Tuesday, October 27th at 5 PM EST. Click here to register. The Canadian Technician Webinar Tuesday October 27th, 2015.
Good trading,
Greg Schnell, CMT


