While we often get caught up in the day-to-day swings of the market, sometimes a broader view is important.
The Canadian Stock Exchange Index ($TSX) tested the bear market resistance line on the PnF Chart this week. As one of the earliest charting methodologies, this is a well-respected charting system. Currently, it has broken out to a buy signal by creating a higher column of x's. It also broke above the columns that stopped at 12800. Click on this link to see the current version. As we approach 13000, this is an important test point. If the market can push through here, this could mark a meaningful change in trend. At this point, it is too early to say if the index will fail here or break through.
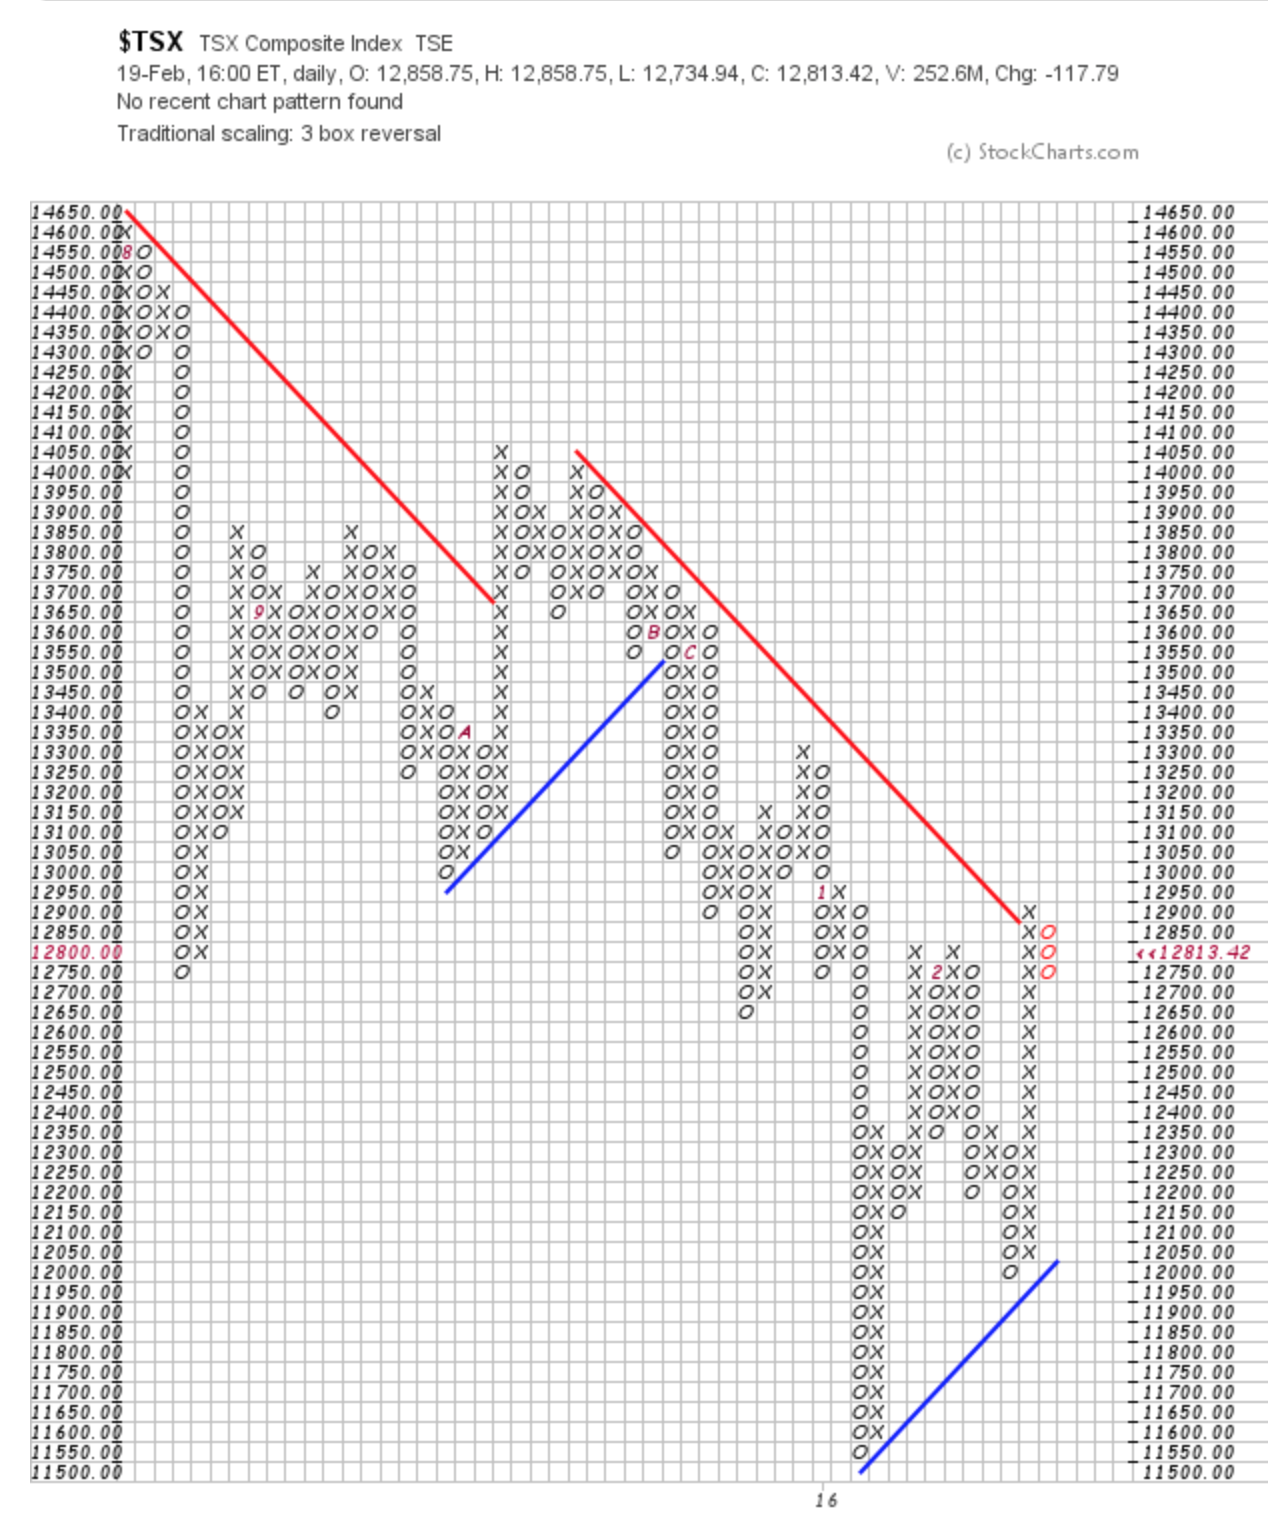 With a little nudge from any of the big sectors; miners, the oil and gas sector, or the banking sector, we could see a meaningful breakout. If it fails here, this should be respected as we are at a major horizontal resistance level. If we look across to the left, we can see the Canadian Market was bouncing off the 13000 level in 2015 and trying to push higher. Now it has been trapped below and this is an important change trying to push it from bear (under the red trend) to bull (above the blue up sloping trendline). The blue line formed (they are drawn by the software automatically) because we briefly pushed above the red trend switching to a bull market condition. This pullback creating a column of o's could be very brief or extend down. We are at a significant place on the chart that suggests the horizontal support/resistance level of 13000 as well as the PnF resistance trendline are in play.
Continue to click on this link to stay updated on this emerging attempt to switch to a bull market. $TSX PnF Chart.
I also published an article in Chartwatchers discussing the importance of the currencies this week with respect to commodities. Currencies Are Ripe For Showing Trend Changes In Commodities. It hints at some important levels in the Euro and the British Pound. You can also follow me on twitter @schnellinvestor. Click Yes below to subscribe to these articles by email.
Good trading,
Greg Schnell, CMT


