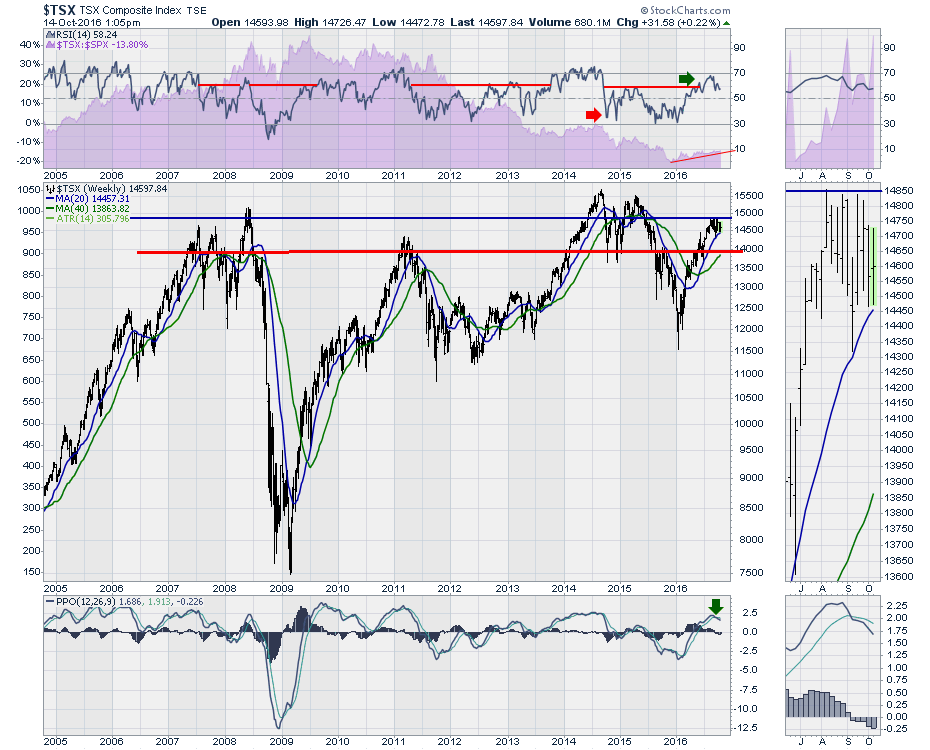
The $TSX has struggled to break through 15000. I have drawn a line at the recent high of 14850. The 20 WMA does a pretty good job of supporting the $TSX. In the zoom box, we can see the last two weeks have been supported by the 20 WMA in blue. If this rolls over and closes below 14500, a test of 14000 is likely. This is near the 40 WMA level and a major support/resistance level around 14000.
With the RSI still signaling a bull market, this might just be a pullback. However, the PPO has rolled over from a pretty high level now. Be very careful about being stubborn here. The market has a lot of breadth indicators dwindling. Like the $SPX, we have been making lower highs since the August 10th high. On October 10th, the Nasdaq 100 ($NDX) made a new high. This has not been confirmed by the $SPX, the $INDU, the $RUT or the $TSX. These divergences can be important in showing intermediate tops.
Oil has traded down all week after gapping up Monday morning. If oil can't hold up, and the gold miners are already weak, this will probably drag the broader $TSX down.
My last few articles have been discussing the breaking trend lines around the commodities, currencies, and equities. Here is the link to a fast-paced webinar trying to summarize the current position. Commodities Countdown 2016-10-13. Here is the link to the previous week which also had some trend lines cracking. Commodities Countdown Webinar 2016-10-06. I did a Canadian focused webinar and you can follow this link for more information and why the cracking of these trendlines are worrisome. Canadian Technician 2016-10-04.
This is your last chance to register for the Canadian Technician's Day 2016-10-15 which is TOMORROW. We would love to have you attend.
Good trading,
Greg Schnell, CMT, MFTA.


