The financial sector charts are setting up for a big move. We are at the big inflection point, so the time to start watching these stocks for a breakout is now.
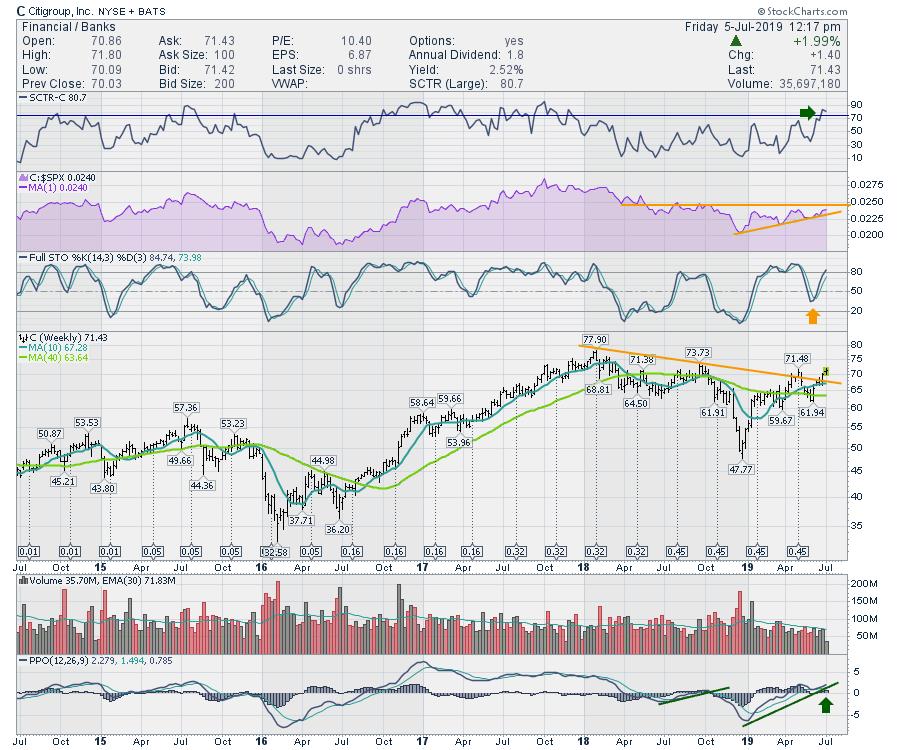
The first stock in question is Citigroup (C), which looks really nice here. The SCTR ranking has moved above 75, which is a great clue that the stock price is moving better than most of the large-caps. A SCTR compares the pace of price movement against other stocks in a group, then ranks the fastest movers. Citi's SCTR has just moved to its highest level in over a year. The full stochastic indicator gave a nice bullish bounce around the 40 level. The stock has clearly broken the down trend, and a move above $73.73 would be a new 52-week high. Lastly, the PPO is accelerating above zero, which is very bullish.

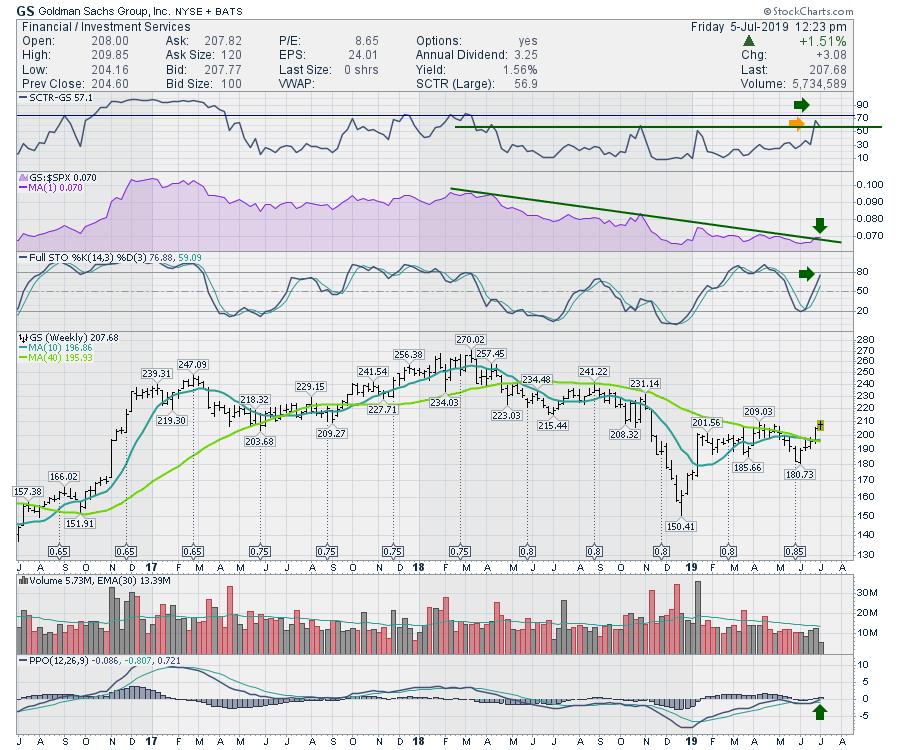
The next stock is Goldman Sachs (GS). Once again, the SCTR is at the highest level in a year. The relative strength in purple compared to the $SPX has marginally broken the downtrend. The next sign of progress would be making new 6-month highs on the purple-shaded indicator. The full stochastic is up near 80. For quick traders, the full stochastic can be a sell on a daily chart, but we can see that it can stay at a high level for months, so this is bullish on a weekly chart. Goldman made a new 6-month high this week, which is a bullish development. On the bottom of the chart, we can see the PPO is close to moving into positive territory. It is already above the signal line, so that's bullish.

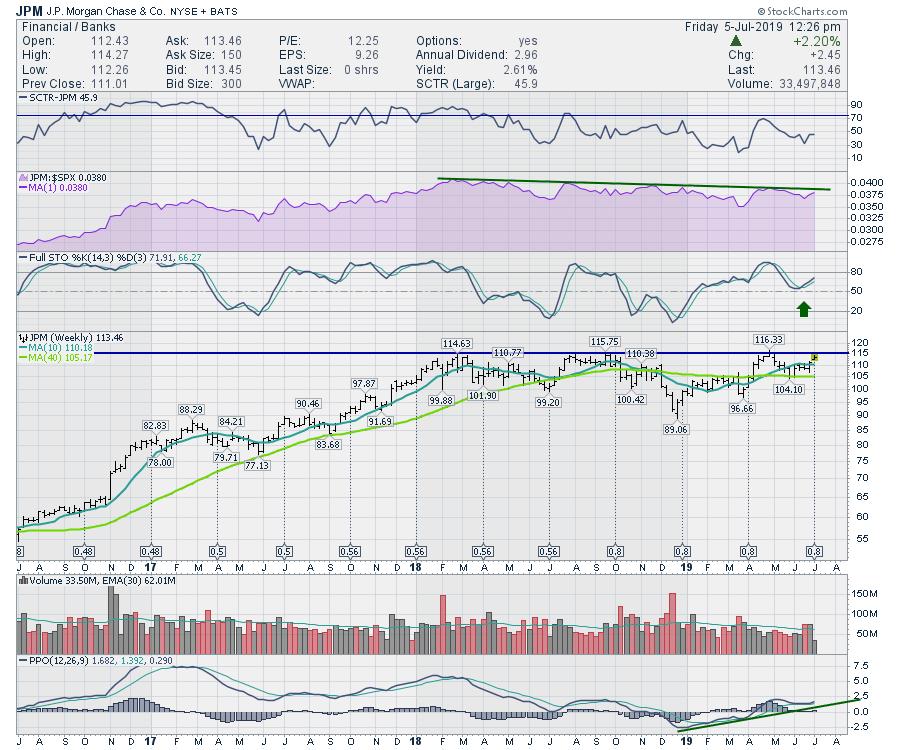
Obviously, the big name is JP Morgan (JPM). This stock has a lot of average signals on the top of the chart, but the flat line on the price chart suggests any breakout here is a big deal. An alert for a move above $115 looks like a nice entry.

Across the sector, there are a lot of nice setups in the financial space. In the video from Friday's Market Buzz, I worked through some more charts in the financial sector.
 Market Buzz Financials
If you can take some time this weekend, this looks like a nice place to plant some seeds for the second half. I'll have more information on my weekend videos.
Good trading,
Greg Schnell, CMT, MFTA
Senior Technical Analyst, StockCharts.com
Author, Stock Charts For Dummies
Want to stay on top of the market's latest intermarket signals?
– Follow @SchnellInvestor on Twitter
– Connect with Greg on LinkedIn
– Subscribe to The Canadian Technician
– Email at info@gregschnell.com


