When bears start browsing nearby, there are multiple reasons to be concerned. As I mentioned in my ChartWatchers article, 3 Serious Signals Should Send Shock Waves, there are a lot of charts pointing to caution.

One of the best things that happened to me upon getting my CMT designation was the ability to catch up with great technicians in New York at the annual conference. Paul Desmond, Tom DeMark, Larry Williams, Tom and Sherman McClellan, David Keller, Julius de Kempenaer, Scott O'Neil, Jerry Parker and Tom Dorsey, to name a few of the great people I have met. All of them crafted ways to work through the markets over time. My relationship with StockCharts had me meet John Murphy, Carl Swenlin, Tom Bowley, Greg Morris and Arthur Hill. My roles with the CSTA introduced me to Martin Pring, Ron Meisels, Donald Dony, Cory Mitchell, Barry Powley, Dwight Galusha, Hap Sneddon, etc. It's been a fabulous career to meet so many great people.
One of the reasons I bring that up is because most of the leading technicians have spent years trying to improve their technique. Many have shared ideas with me through presentations or one-on-one discussions.
Have you ever looked at John Murphy's blog article from March 10, 2009, one day after the lows of the biggest and fastest bear market in 50 years? If not, here is the leading paragraph:
"S&P 500 COMES VERY CLOSE TO 62% RETRACEMENT ... Some of our readers have asked me to revisit potential downside targets for the market. Chart 1 is an updated version of a chart I showed on February 27. That earlier chart showed that a 62% retracement of the secular bull market from 1982 to 2007 fell around the 660 level for the S&P 500 (third line). I point this out today because the S&P came within six points of that downside target yesterday. There's no guarantee that stocks won't fall below that potential support line, but the fact that it's so close may be reason for some technical traders to do a little bottom fishing. Although I can't show it here, there's another very long-term support line drawn under the lows of 1932, 1942, 1974, and 1982 which currently sits near 560. That's approximately 100 points (or 15%) below this week's intra-day low. [That chart is shown on page A6 of today's edition of Investors Business Daily]. I wouldn't be at all surprised to see that lower line tested before this bear market runs its course. If it is, let's hope it holds." - John Murphy March 10, 2009.
It is awesome that he said technicians would start bottom fishing right there in one of the biggest downtrends in a lifetime.
I would suggest that I have worked on so many different ways to help find bottoms and tops. Weaving through the creativity of all of these artists mentioned above is a desire to be better. Inspiration like John has driven me hard. I emailed all my family and friends on the 11th of March, 2009 saying you might want to put money to work!
Some people are happy to be late to the lows. An example might be they start buying when the market is above the 200-day moving average only. With all that stormy price action that happens below, they're not interested. Others, the regular day traders, are just looking for quick reversals, but coming off the lows can be seriously rewarding. For each of those day traders, they'll have quite a few stop outs.
If I look across just 2 of my chartlists on weekly, monthly and the odd daily time frame, I have 116 different signals on the charts telling me that lower is more likely. If I get into some of my scanning data, I have another 30 signals over there. When the charts change, I'll change, and though I might be a week or two early or late, I will be close for a person who wants to trade weekly charts. I think those who followed the progression of my commentary over the last year might agree, and I have built some more new systems to help improve on that timing in the last few months. I am currently back-testing them. It's an endless road!
The main reason I want to point this out is that I think it is very important to measure the heartbeat for the market. During my video today, I pointed to an old system I had built back in 2014-2015 was based on the Nasdaq. I haven't looked at it for years, but, magically, I did this week. The funny part was that it literally triggered a big sell signal on Friday's close that suggests the top is in. I guess I should add those two charts to the list so that makes 118 different signals suggesting lower.
If I had to pick three reasons to be cautious:
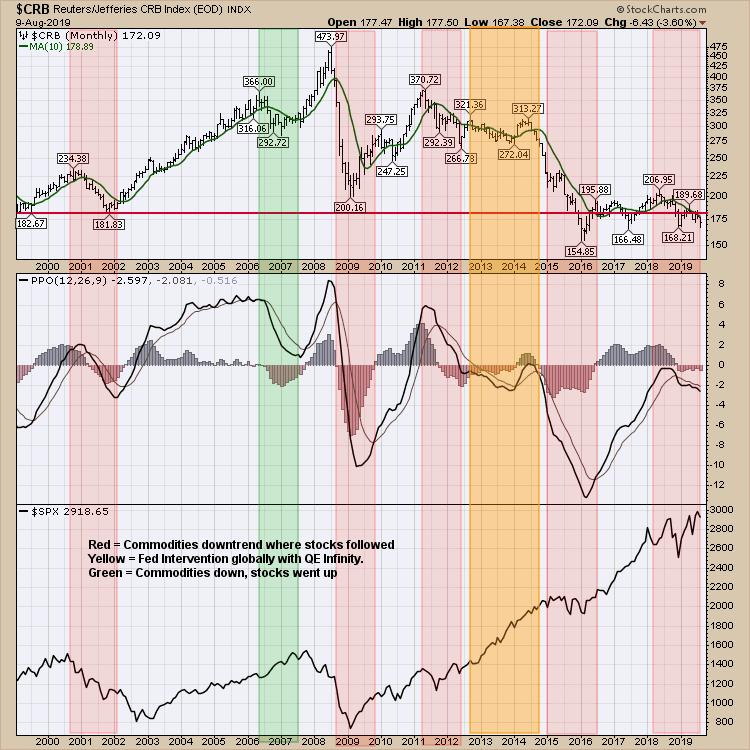
1) Weak Commodities are ringing a bell globally that no one wants to hear. Notice when commodities are down and feel the vibration of the wobbles the stock market feels. If a China deal is done and commodities soar, this looks like a sponsor for a big bullish push!
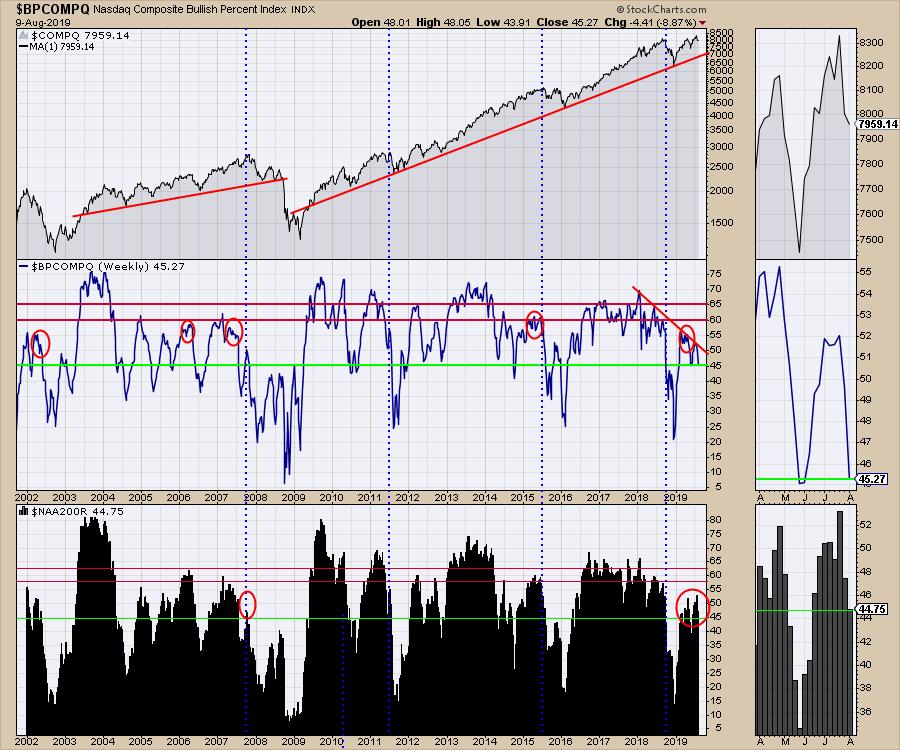
2) Continued weakness in Bullish Percent charts/Percentage of stocks above the 200-DMA. The green lines mark the readings on Friday's close.
First, the Nasdaq:
For the NYSE:
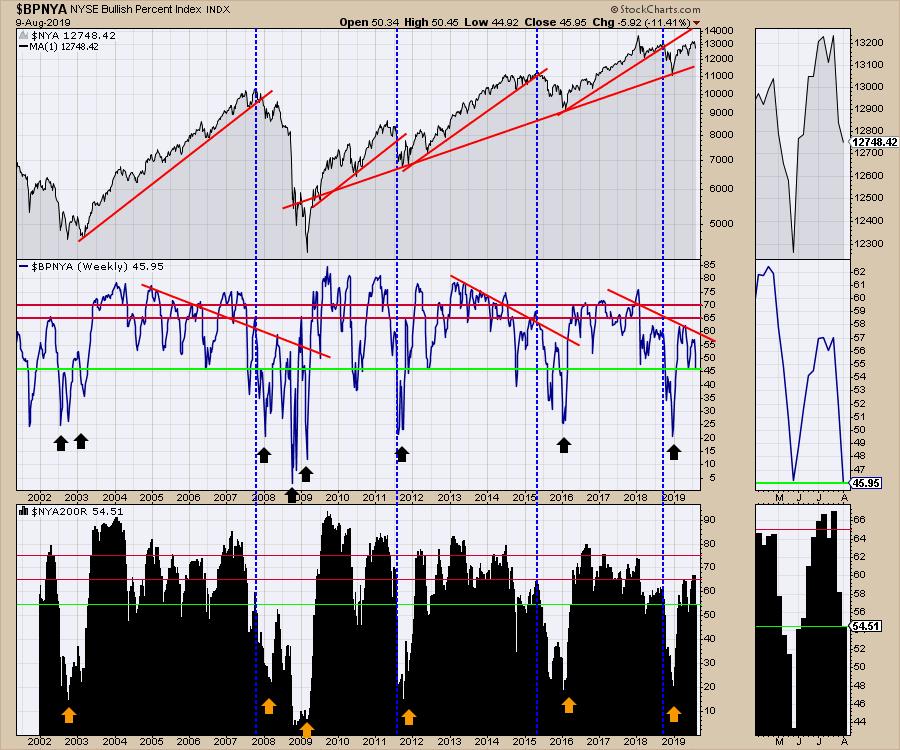
Again, both of these charts weaken before the big indexes break. That is the entire reason to watch them - advance notice!!!! They are giving us advance notice. Both of them are below 50% for bullish percent indexes. I remember saying the same thing in September 2018 as the stocks were weak.
3) The wide gap between the financials and indexes.
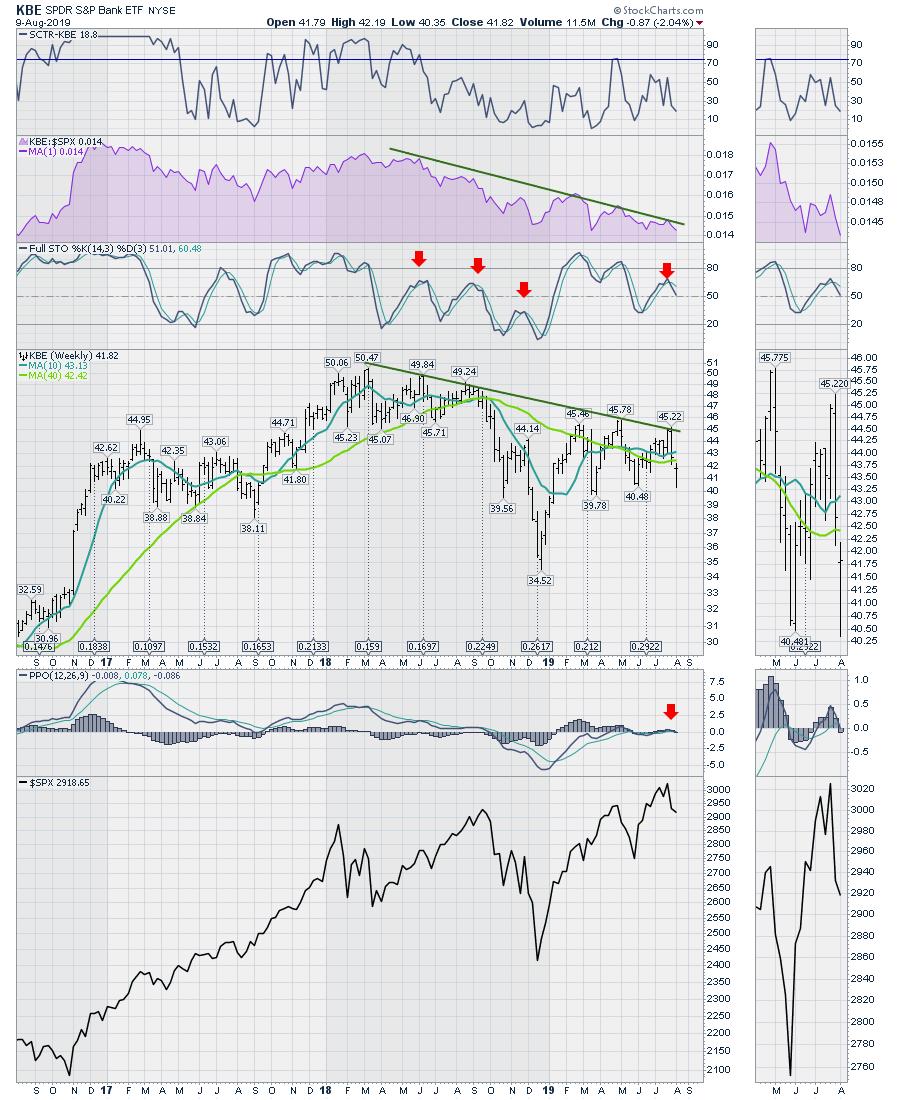
I could pick many more, but the financials are telling us to be careful. Do you agree that the Fed dropping interest rates to be polite and safe seems implausible? That doesn't work for me. What do we expect them to say? "We see disaster ahead?" How about delivering upcoming weakening economic data like a smurf and soft-selling it!
The Fed dropped interest rates in Sept 17, 2007. The stock market topped three weeks later, on October 9th. The Fed dropped interest rates two weeks ago with these weak financial charts. Ouch.
There is a lot more information to be found on my weekly videos. The current video to pair with this article is 3 Bears Take Over The Kitchen, in which I work through a large number of charts to communicate what I am seeing.

The video is already being viewed on YouTube, and I am sure there are doubters. I will say this; when the data changes, I will too. But, right now, an uptrend is not one of the directional clues I am getting. One positive note was a weekly hammer candle on the $CRB. Perhaps that will morph into a new uptrend. I also don't have any tweets telling me to be bullish on China/America trade in September. Lots of cross-currents, but the investors seem reluctant to push things higher here.
If you like the video, please give it a thumbs up! If you think I am missing something, you can e-mail me at the address shown at the front of the video! Please take the time to comment below! Feedback, in both directions, is helpful!
Good trading,
Greg Schnell, CMT, MFTA
Senior Technical Analyst, StockCharts.com
Author, Stock Charts For Dummies
Want to stay on top of the market's latest intermarket signals?
– Follow @SchnellInvestor on Twitter
– Connect with Greg on LinkedIn
– Subscribe to The Canadian Technician
– Email at info@gregschnell.com


