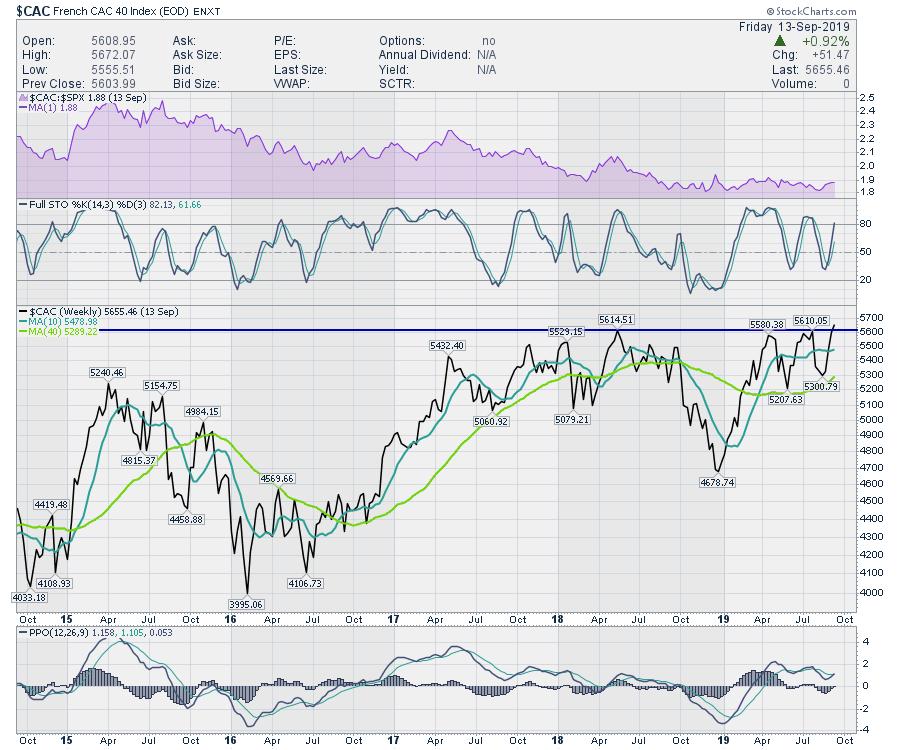
One of the concerns about the recent rallies in the USA has been the lack of support by the global indexes. While the USA went higher, the rest of the world has been stalled. This week, that began to change. To start, France broke out above a two-year consolidation to new 52-week highs.
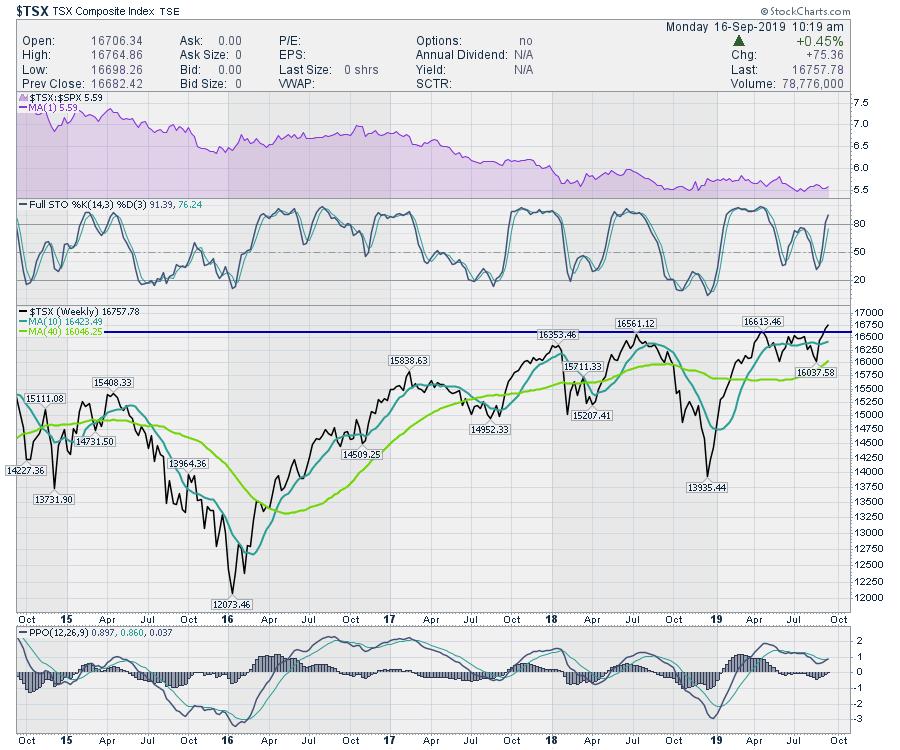
Canada also broke out above the same multi-year ceiling. It marked an all-time high for the $TSX.
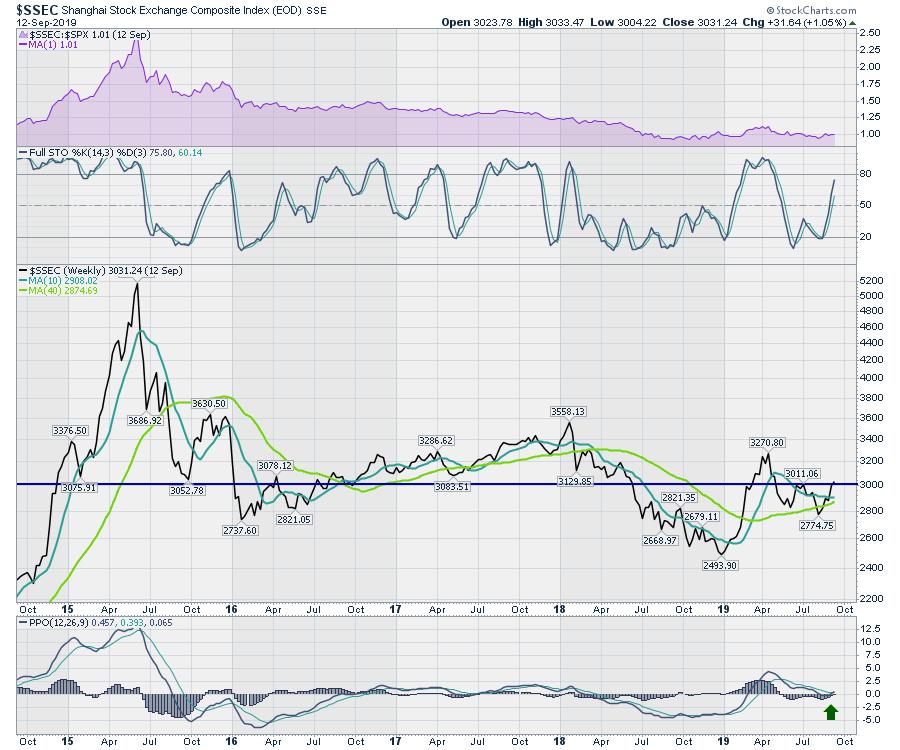
These developments will be very helpful for a big bull run here if the rest of the global markets join the party. The Shanghai market ($SSEC) closed at a higher high this week as well.
Japan ($NIKK) also surged. It would not take much to get Japan to the highs for the year. It has started to make higher highs and now needs to move above the April/May range.
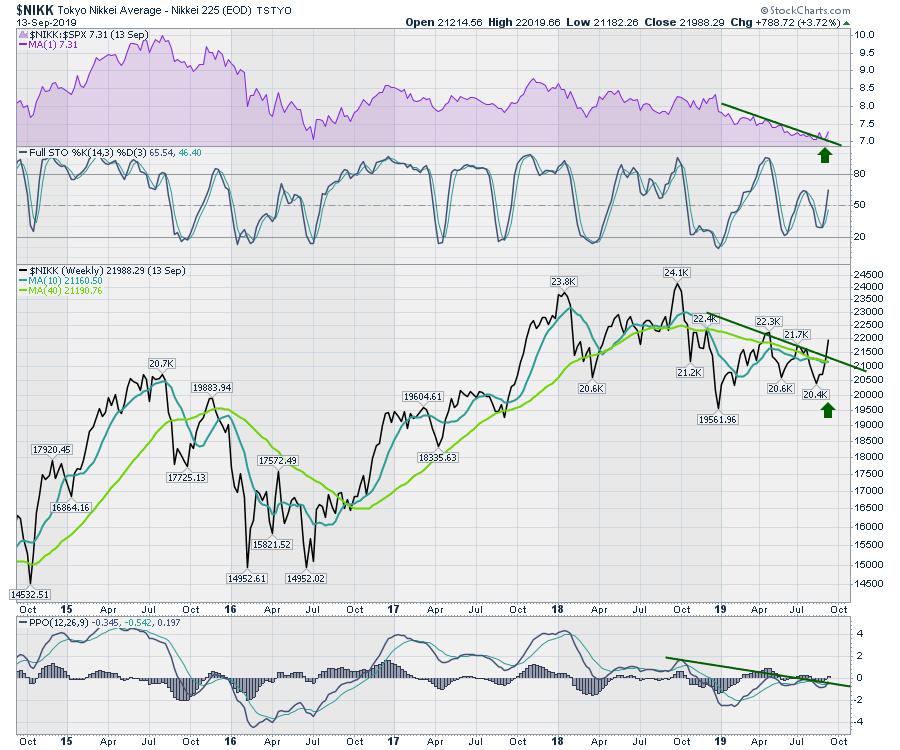
As we can see, the global outlook is improving.
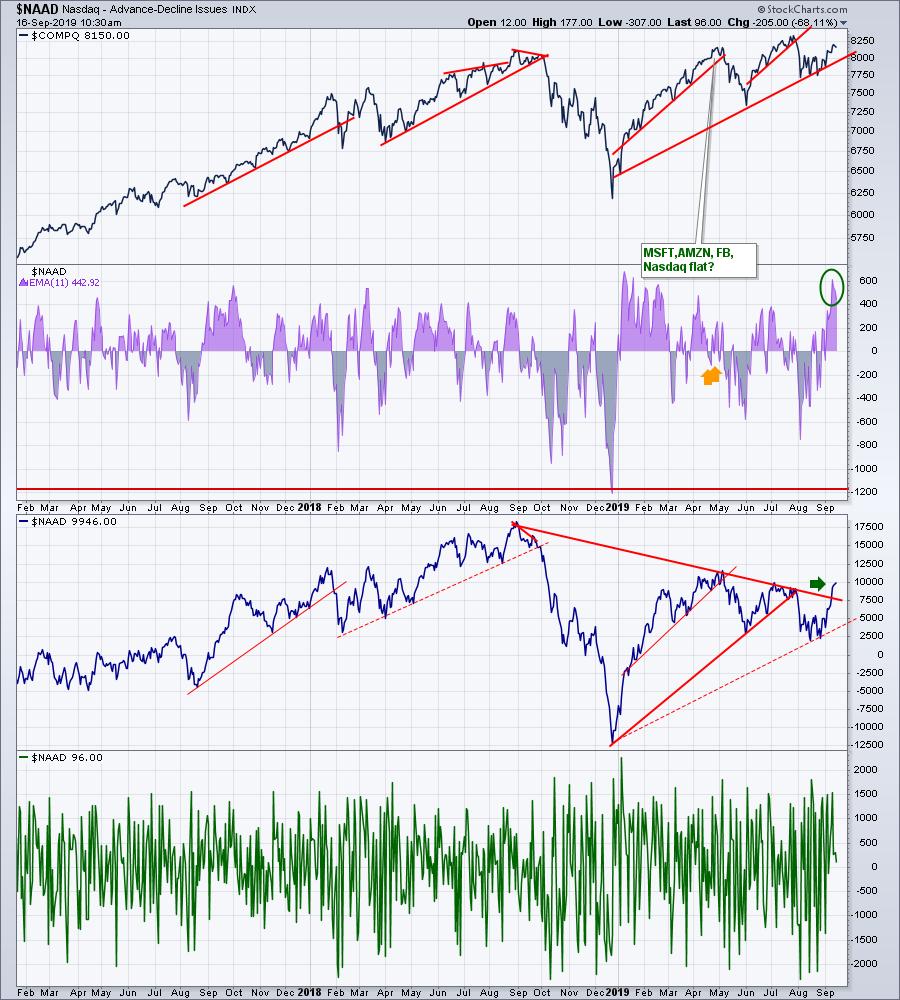
Additionally, the Nasdaq Advance/Decline line ($NAAD) is more optimistic than it has been in a long time. The chart below shows a few different methods of representation. At the bottom is the raw data series. The third panel shows the cumulative setting that shows the indicator breaking the down trend for the first time in a year. If we have another good week, we will take out the July highs. On the second panel, we see a two-week (11 period) moving average. The spike is similar to the original bull thrust off the December lows.
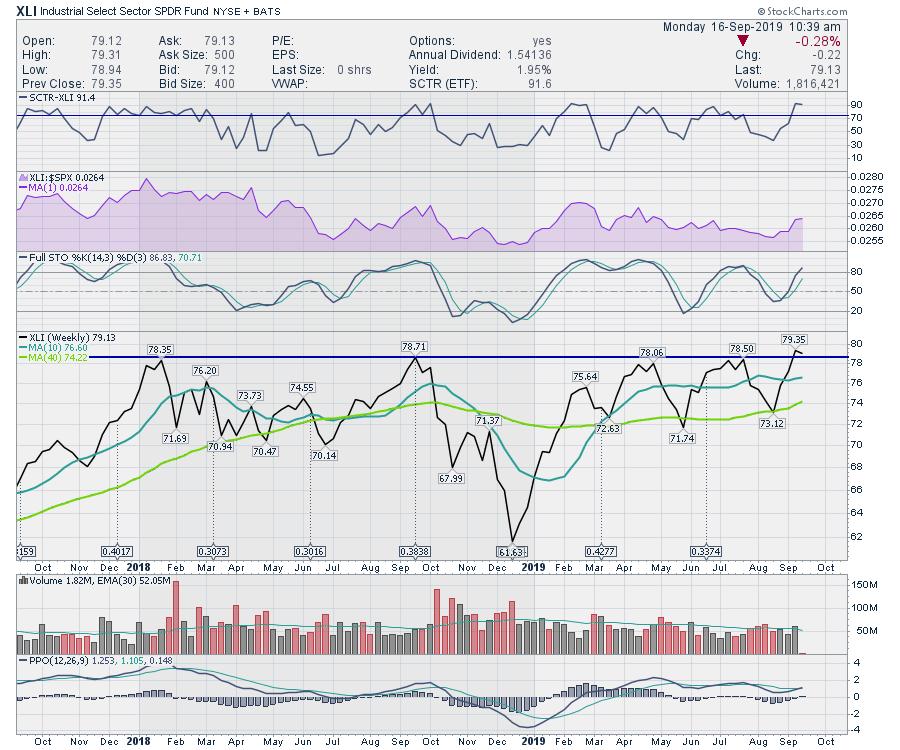
The industrials ETF (XLI) closed at fresh highs on Friday as well. If the industry group is breaking out, that bodes well for the industrial metals.
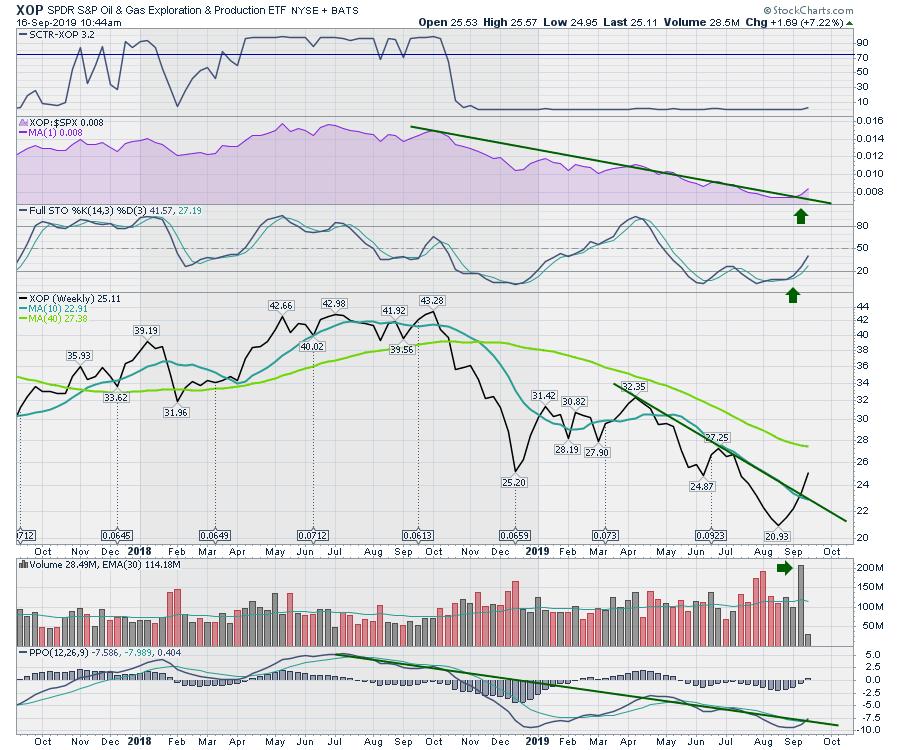
There is lots to absorb this week. The Saudi oil situation, the Fed meeting Wednesday and quadruple witching Friday will affect trading significantly. I spoke at Golden Gate University on Saturday, where I talked about the energy stocks starting to get going. Monday is continuing to add to that theme. Below is a weekly chart that includes Monday morning trade. We have to see the end of the week's close to validate the breakout, but the chart has been improving for a few weeks now. I would like to see the downtrend in PPO momentum break above the down-sloping trend line.
It was a rapid-fire video this week with lots to cover, but I remain bullish and this initial thrust data from the advance/decline line looks good. Here is a link to the video (Global Indexes Start Breaking Out).
In addition, my new website is starting to take shape. The target date for the subscription service to start is the end of September. Please head over to gregschnell.com and enter your name to see the kickoff of the subscription service. I'll have a stunning offer for the people who have been reading my work in the past.
Good trading,
Greg Schnell, CMT, MFTA
Senior Technical Analyst, StockCharts.com
Author, Stock Charts For Dummies
Want to stay on top of the market's latest intermarket signals?
– Follow @SchnellInvestor on Twitter
– Connect with Greg on LinkedIn
– Subscribe to The Canadian Technician
– Email at info@gregschnell.com


