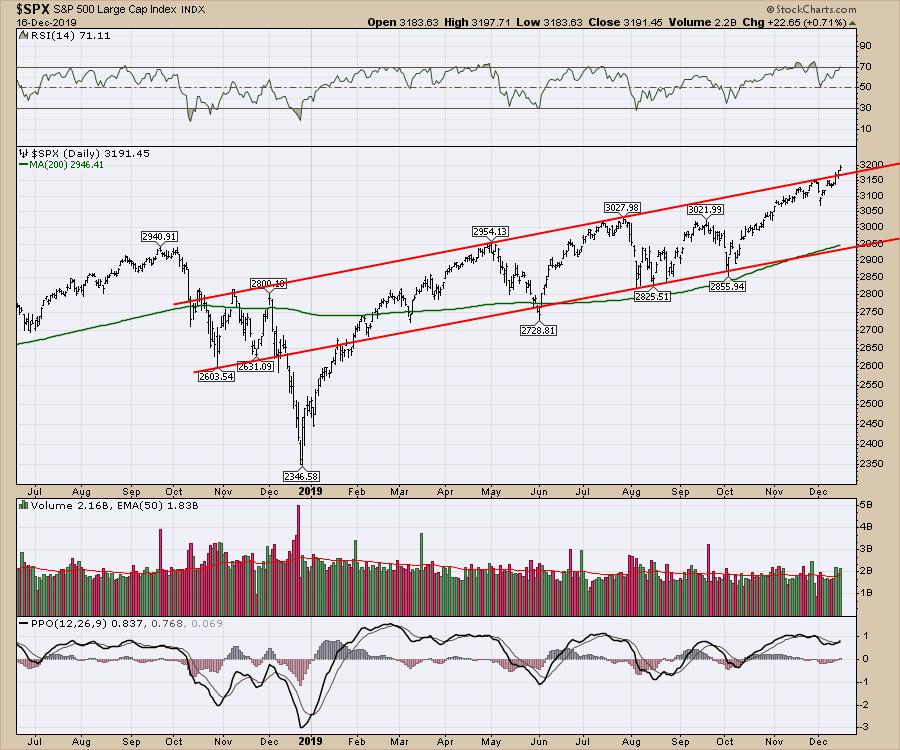
Since JP Morgan (JPM) announced earnings on October 15th, the overall market has been accelerating higher ever since. It was a few days after (October 28th) that the $SPX started to break out; other indexes around the world started breaking out as well. With Monday's burst, we have pushed above the upper channel. There is no law that it has to slow down!
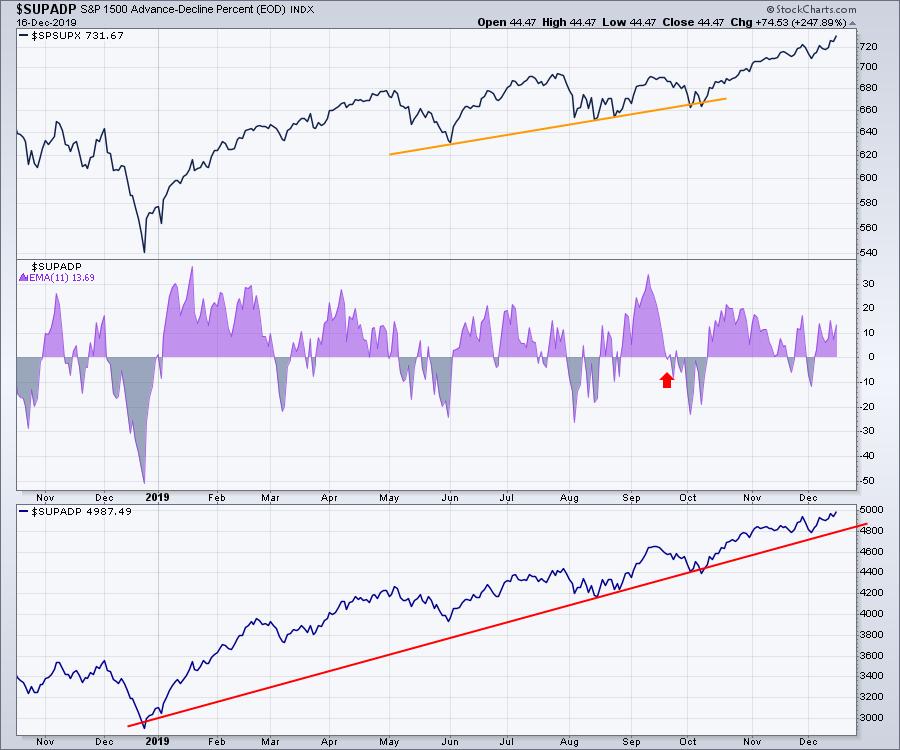
All my private indexes are still bullish. I continue to watch the advance/decline data for hints of trouble, but it continues to climb. On this chart below, the lower panel is the cumulative advance decline line. When that trend starts to weaken, it can be a clue the market is starting to weaken. Clearly that is not happening. In the middle panel is a 2-week moving average of advance/decline data. All the charts are bullish.
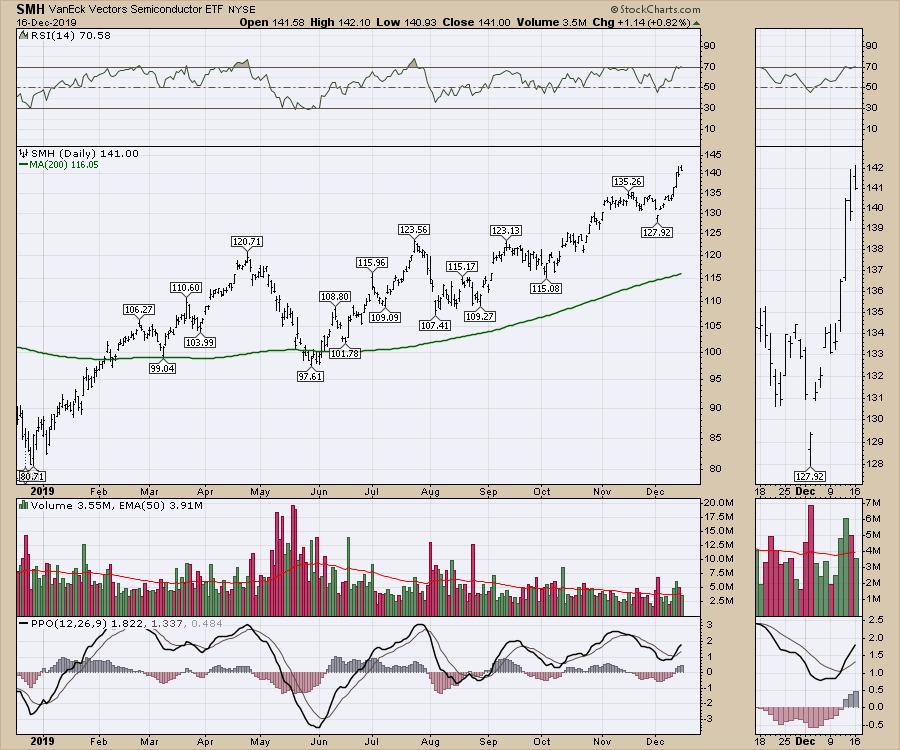
Leadership groups like the semiconductors are still climbing. The biggest weakness on semis showing up is that the price closed at the bottom of the price bars the last two days before going on to new highs. While it might need to breathe a bit before continuing the upward march, it has been an amazing run for an entire year. Notice the December 26th low in the bottom left and the price action driving into the top right.
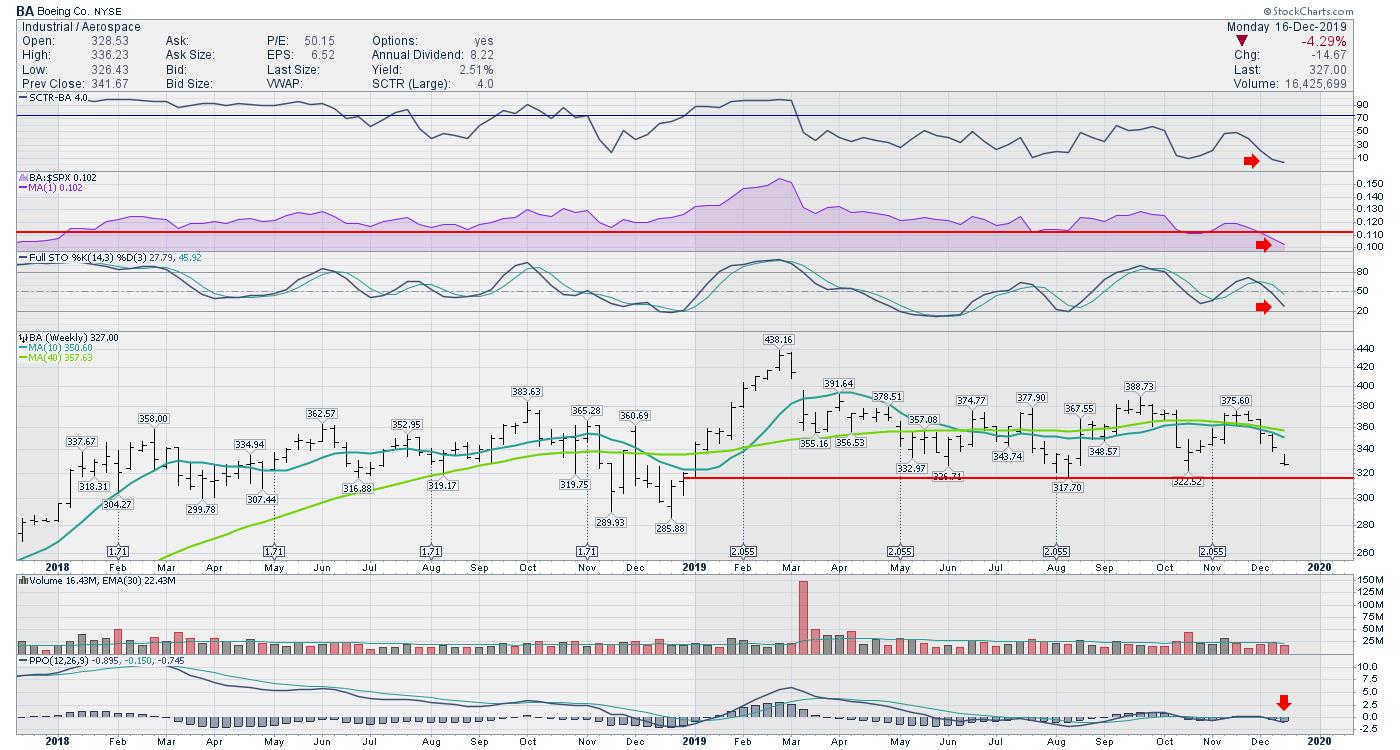
Boeing (BA) is in the news this week with a dramatically different narrative than one year ago. With the suspension of production on the 737 Max today, this Boeing drag on the Industrials ETF continues. Boeing is hitting two-year lows in relative strength compared to the $SPX. The descent I referred to in the title was the relative strength. This is shown on the purple area chart. The institutional investors are losing their desire to support the stock as it creates underperformance on their overall portfolio. For people with a vision years out, it might be worth waiting. For portfolio managers who get paid or fired for results relative to an index, it has been a dangerous hold. The sudden nose dive right at the end of the year crystallizes the damage. For me, one of the technical concerns is the PPO is starting to move down below zero. That is very weak momentum for the industrial giant. This stock could really lose support as downward momentum accelerates.
On this week's video, I worked through Part 1 of a deep dive into the major Industrial companies. Click here to check it out. There are some other names that look like better choices than Boeing.

Continue to enjoy the uptrend while it lasts! I want to take this moment to thank everyone for your support of my work. It is the wonderful people that write kind words of support that fuels my work. I wish you all a happy, healthy, safe holiday season! In 2020, let's have our best year ever!
Good trading,
Greg Schnell, CMT, MFTA
Senior Technical Analyst, StockCharts.com
Author, Stock Charts For Dummies
Want to stay on top of the market's latest intermarket signals?
– Follow @SchnellInvestor on Twitter
– Connect with Greg on LinkedIn
– Subscribe to The Canadian Technician
– Email at info@gregschnell.com


