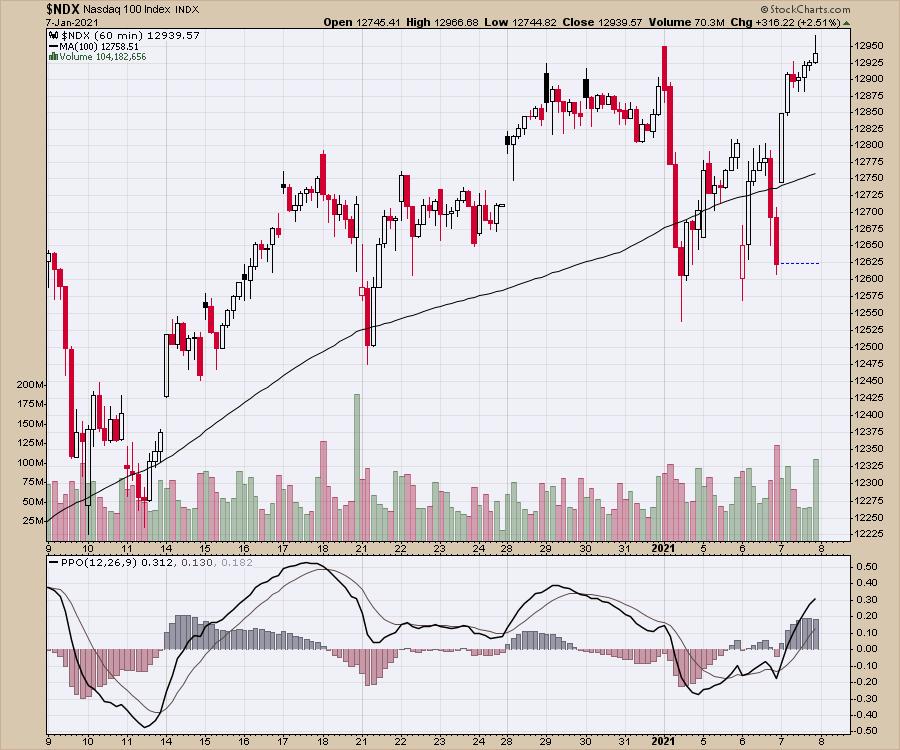
With the strong political backdrop drawing attention, the stock market continues to move higher. The last week of December saw the market grind sideways. The first three days of this week saw the market test the underside of the previous week. But Thursday saw the Nasdaq 100 soar over 2.5% to its highest closing high. It was straight up all day. While the market closed just above the previous highs, the push in the last hour set the chart up with a candle making another higher highs. This also turns the Nasdaq positive on the year.
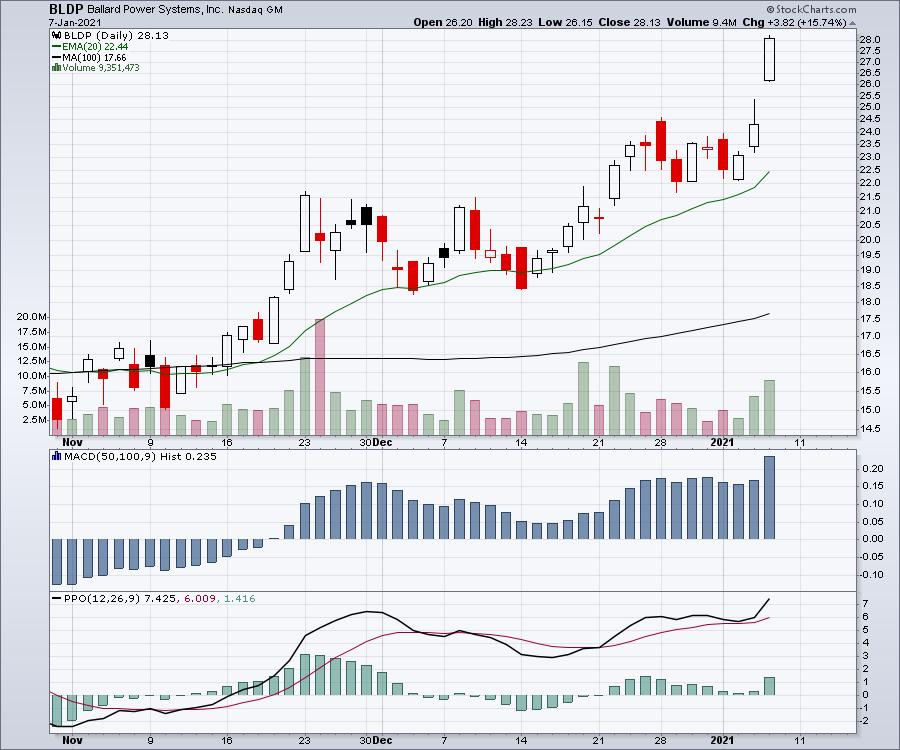
Another chart showing a bit of strength is an alternative fuel technology. Ballard Power broke out from a sideways consolidation, and continues to be one of the more interesting venues for investing in alternative energy, not just electric. Alternative energy promises to be one of the more popular themes and we have been tracking it through our electric car newsletter over the 4th quarter of 2020. More info at Gregschnell.com
This area of alternative energy is really being pressed higher from all sides. Toyota has a nice offering using hydrogen fuel in combination with electric. Toyota. But it is also in buses, highway trucks and short commute delivery vans.
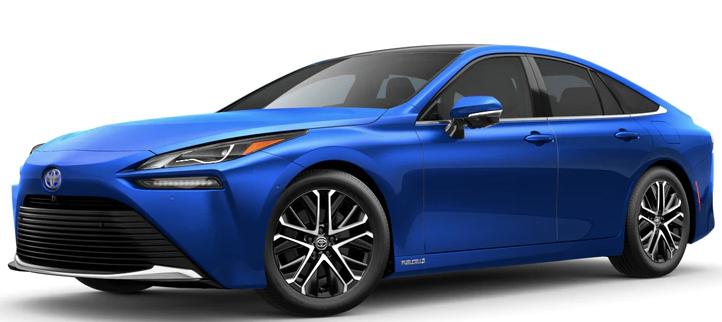
Image: Toyota.com
As the technology evolves, watch to see the changes in how hydrogen is separated. There are two types: Blue hydrogen and green hydrogen. Blue hydrogen comes from natural gas typically and green hydrogen comes from alternative energy (eg. Wind and solar) power being used to separate hydrogen.
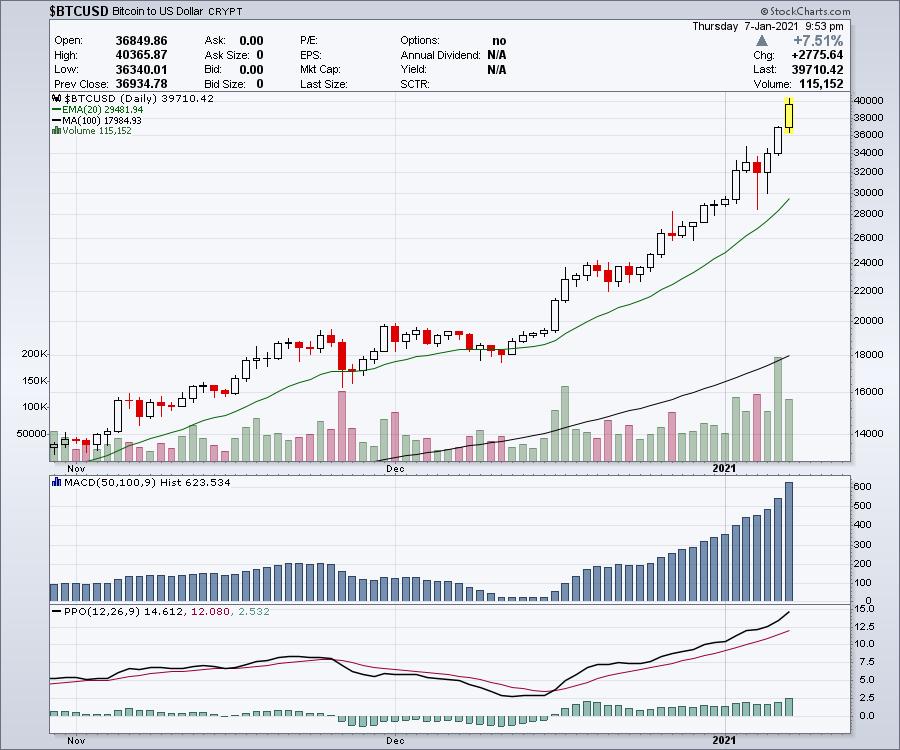
The next chart of interest today is Bitcoin. Up $3000 on the day at one point, Bitcoin continues its parabolic arc to the moon. I watched a YouTube basement dweller predict an average of $50,000 for 2021, based on two lines in an internet article. He was also pumping three other affiliate sites to help him with his trading profits.
Other targets are out there with six digits. As long as it keeps soaring, everyone who owns it wants to keep it. There is no doubt about the parabolic move. It is really the issue of 'Whose the next buyer?' !
I have no opinion on trying to buy it here. But it is a crazy, ballastic chart! Have a great night!
Good trading,
Greg Schnell, CMT, MFTA
Senior Technical Analyst, StockCharts.com
Author, Stock Charts For Dummies
Want to stay on top of the market's latest intermarket signals?
– Follow @SchnellInvestor on Twitter
– Connect with Greg on LinkedIn
– Subscribe to The Canadian Technician
– Email at info@gregschnell.com


